The Most Dangerous Cities in Arizona
We ranked Arizona's cities and counties by how many people die on their roads, per resident. Tucson, not Phoenix, came out first.
#2 OF EVERY US CITY OF 500,000-PLUS.
We read the crash record the way we read a case: the people, the rate, and the pattern underneath them.
AZ Law Now pulled the federal fatality record and the Census population counts and computed the per-capita traffic death rate ourselves, city by city and county by county. It names no one and sells nothing. It just shows the work.
Tucson, not Phoenix, is the most dangerous city in Arizona
Our analysisWe ranked Arizona's largest cities by how many people die on their roads, measured against how many people live there. Tucson came out first, and it is not close. From 2020 through 2024, 675 people were killed on Tucson's roads, a rate of 24.95 deaths per 100,000 residents a year.
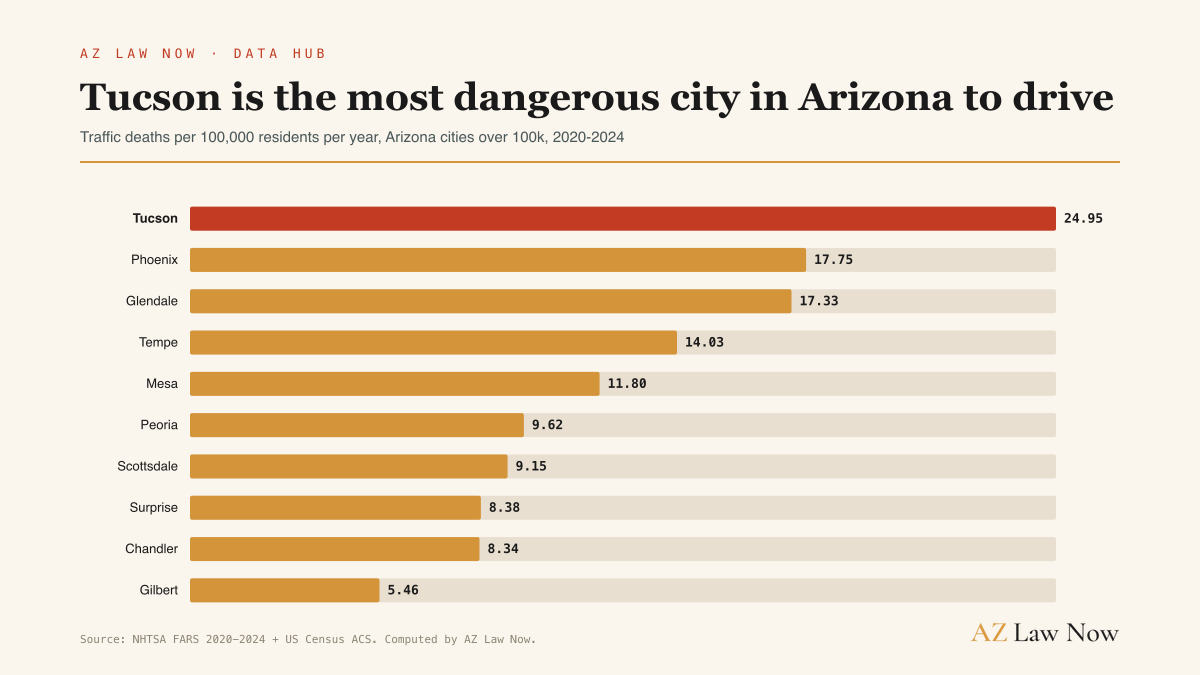
Phoenix records far more deaths in raw numbers, 1,428 to Tucson's 675. But Phoenix holds roughly three times as many people, so per resident Tucson is the deadlier city to be on the road in. We ranked every Arizona place above 100,000 residents, drawn straight from Census population, not a list we hand-picked.
"Every Arizona city above 100,000 residents" is a transparent, rule-based set, drawn straight from Census population, not a list we hand-picked to put Tucson on top.
Two honest caveats travel with the number. A death is counted where the crash happened, so the figure captures commuter and through traffic, not only residents. And it is a five-year cumulative count, so it reads about five times higher than a single-year rate. The same construction is applied identically to every city.
Of every big US city, only Memphis is deadlier to drive
Our analysisTucson's road toll is not only an Arizona problem. Set it against every large city in the country and it still rises near the top. Of every US city with 500,000 or more residents, only Memphis is deadlier to drive than Tucson.
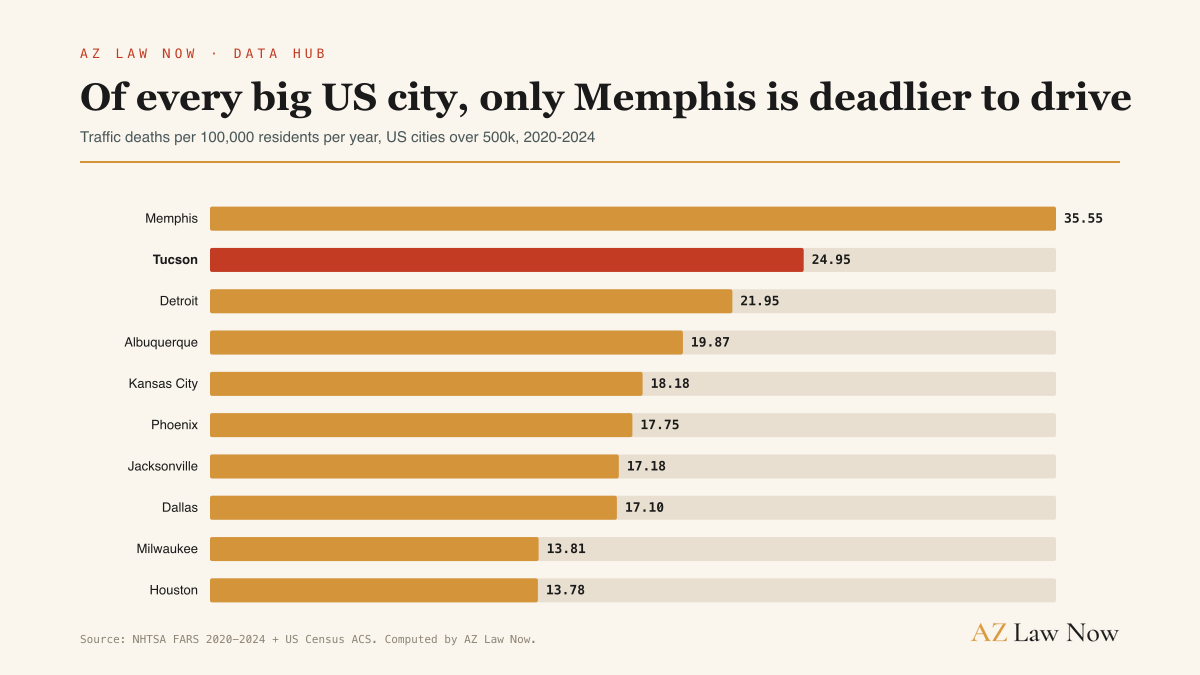
We restrict the field to cities of 500,000-plus on purpose. It removes the small-place noise that makes a tiny town look deadly on a handful of crashes, and it gives Tucson a fair, big-city peer set. Among genuine large cities, only Memphis is worse.
No big county loses more pedestrians per resident than Pima
Our analysisMove from the city to the county around it and the picture gets worse for the people most exposed, the ones on foot. Across all 48 US counties with a million or more residents, Pima County, which holds Tucson, has the highest pedestrian death rate per resident.
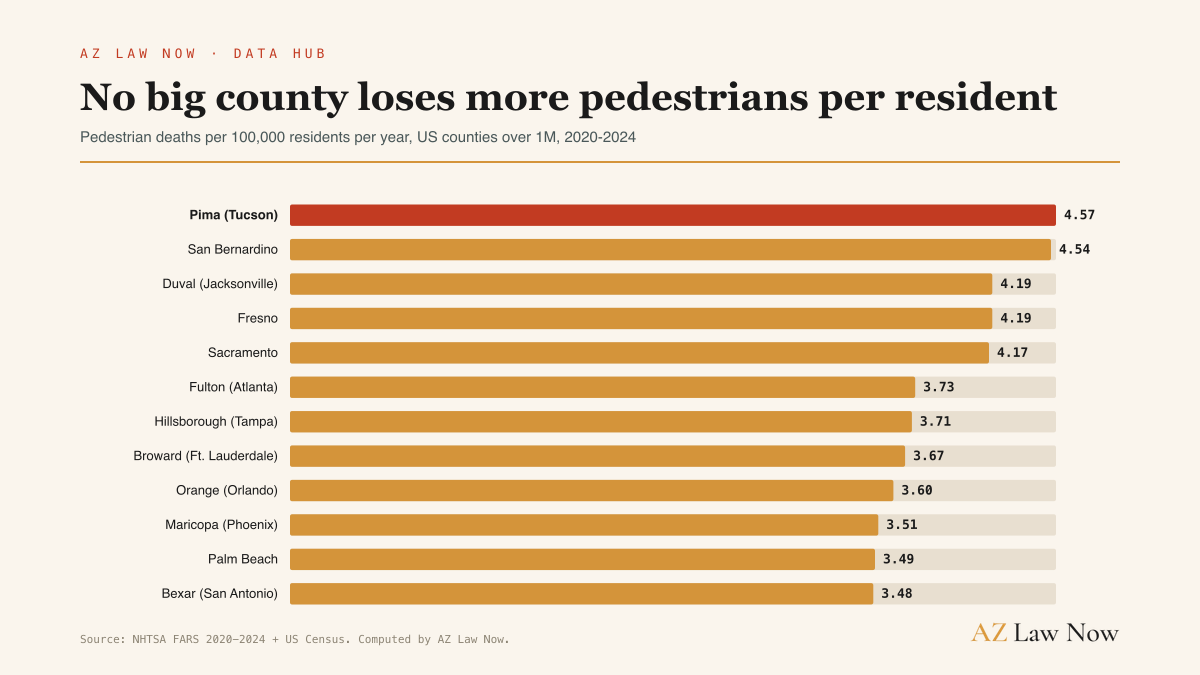
A pedestrian in Pima County dies at a higher rate per resident than in any other major county in America, Maricopa included. The county-to-county contrast carries into driving too: Pima is the 4th-deadliest big county in the nation to drive, and Maricopa ranks 7th. The smaller, quieter-seeming metro is the more dangerous one.
The toll spans the whole county and every way to travel
Our analysisThis is not one bad number hiding a safe city. Break Tucson's deaths down by how people were traveling, and it ranks among the worst large cities in every mode. Map every fatal crash in Pima County and the danger spreads across the whole county, not one corner.
Of all US cities above 100,000 residents, Tucson ranks #4 for cyclist deaths, #5 for motorcyclist deaths, and #8 for pedestrian deaths per resident, 2020 to 2024. The danger runs across every kind of traveler, not one.
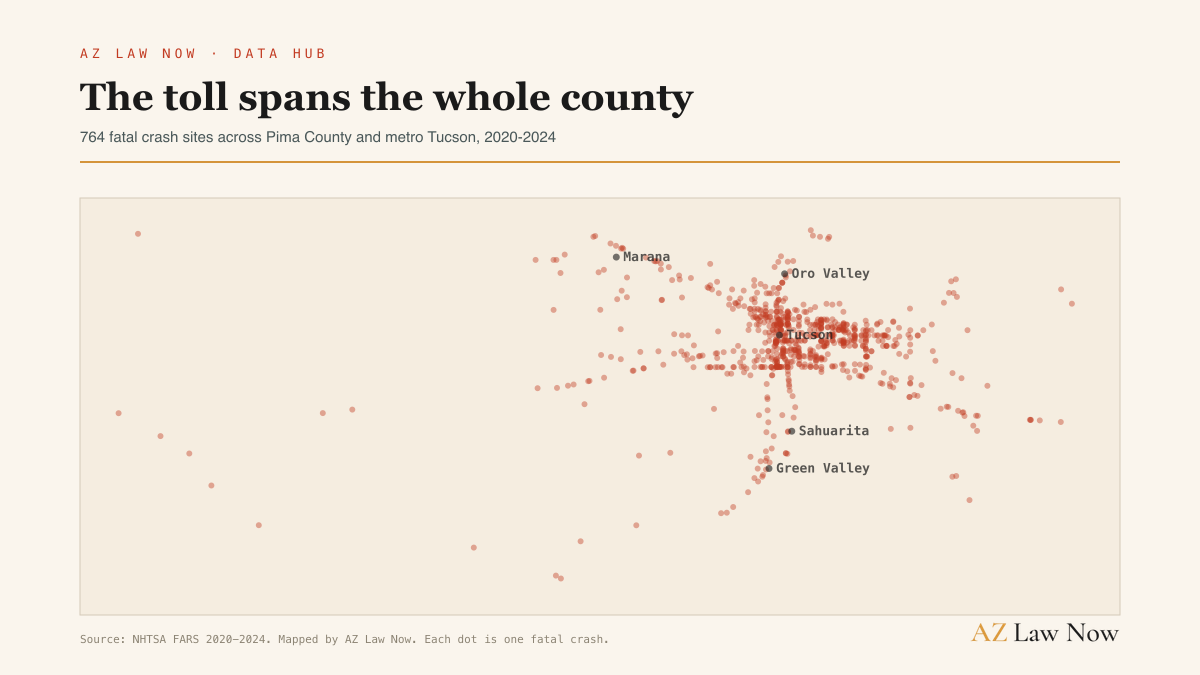
The 764 sites cluster densest along Tucson's major arterials and the I-10 corridor, but they reach north to Marana and Oro Valley, south to Sahuarita and Green Valley, and out into the rural stretches between. There is no single intersection to fix that would move these numbers. The risk follows the road across the entire metro, which is why the per-resident rate, not any one location, is the story.
Put the findings together: the deadliest city in Arizona to drive, second in the nation among big cities, the worst big county for pedestrians, and a danger that follows the road everywhere. The rate is the story.
Tucson and Pima sit inside one of the deadliest states to drive in the country. Arizona records 1.73 traffic deaths for every 100 million miles driven, the 5th-worst rate of any state and 29 percent above the national average. Knowing where the risk concentrates, and that it is not where most people assume, protects families and the public.
We read the record so you get answers.
How we built this
Every figure traces to a named federal dataset: NHTSA's FARS, the federal record of every traffic death, for the death counts (2020 to 2024), the US Census Bureau's ACS 5-year population estimates for the denominators, and the Federal Highway Administration's vehicle-miles data for the per-mile state rate. We read the source, not the news write-up.
The per-capita rates and the rankings are ours. A pedestrian, cyclist, or motorcyclist death uses the federal person-type and vehicle-body-type codes, counted at the person level.
We divided the five-year death count by the resident population, per 100,000, applied identically to every city and county. These are not NHTSA-published figures.
A ranking ships only with a transparent, rule-based set. The Arizona-city ranking covers every place above 100,000 residents, the big-city ranking every US place above 500,000, and the county rankings every US county above 1 million. Pima's pedestrian lead is a tie with San Bernardino, so we report it as co-#1.
First, a crash is counted where it happened, so a city or county figure captures commuter and through traffic, not only residents. Second, the rate is a five-year cumulative count over the resident population, so it reads about five times higher than a single-year rate would.
The same construction is applied identically to every city and county, so each ranking is a fair like-for-like read. One figure is measured at the state grain, not the city grain: Arizona's 1.73 deaths per 100 million vehicle-miles comes from FARS deaths over FHWA vehicle-miles, and reconciles to the NHTSA-published national rate. The analysis reproduces from the raw federal files, so any figure can be rebuilt from the record.