Phoenix's Motorcycle Toll
We ranked America's 12 most populous counties by how fast they lose motorcyclists. Maricopa County, the heart of metro Phoenix, came out first.
12.48 DEATHS PER 100,000 RESIDENTS.
We read the crash record the way we read a case: the riders, the rate, and the pattern underneath them.
AZ Law Now pulled the federal fatality record and the Census population counts and computed the per-capita motorcyclist death rate ourselves, for Maricopa County and every one of America's 12 largest counties. It names no one and sells nothing. It just shows the work.
No big county loses riders faster, not even Las Vegas
Our analysisWe ranked America's 12 most populous counties by their motorcyclist death rate over five years. Maricopa County, the heart of metro Phoenix, came out first. From 2020 through 2024, 569 motorcyclists were killed here, a rate of 12.48 deaths per 100,000 residents.
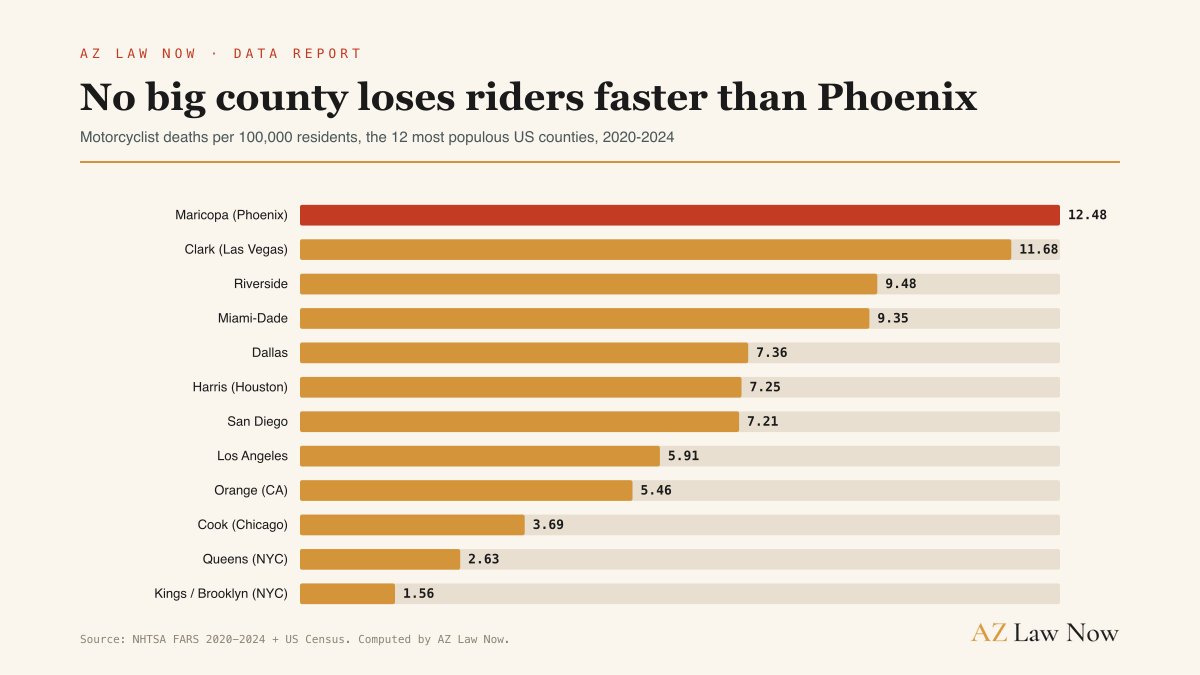
Los Angeles County recorded more motorcyclist deaths in raw numbers, 580. But it ranks tenth here, at 5.91, because its population is more than twice as large. Per capita is the honest comparison, and Phoenix leads it.
"The 12 most populous counties" is a transparent, rule-based set, drawn straight from Census population, not a list we hand-picked to put Phoenix on top. The finding does not depend on where we drew the line.
Widen the field to every US county above 1.5 million residents and Maricopa is still first, with Tampa's Hillsborough County the closest challenger at 12.28. The #1 holds.
And the toll is climbing
Our analysisThis is not a flat line that Phoenix happens to sit on top of. Maricopa's motorcyclist death rate has climbed across the decade, from 8.86 per 100,000 in 2010 to 2014, to 9.89 in 2015 to 2019, to 12.48 in 2020 to 2024.
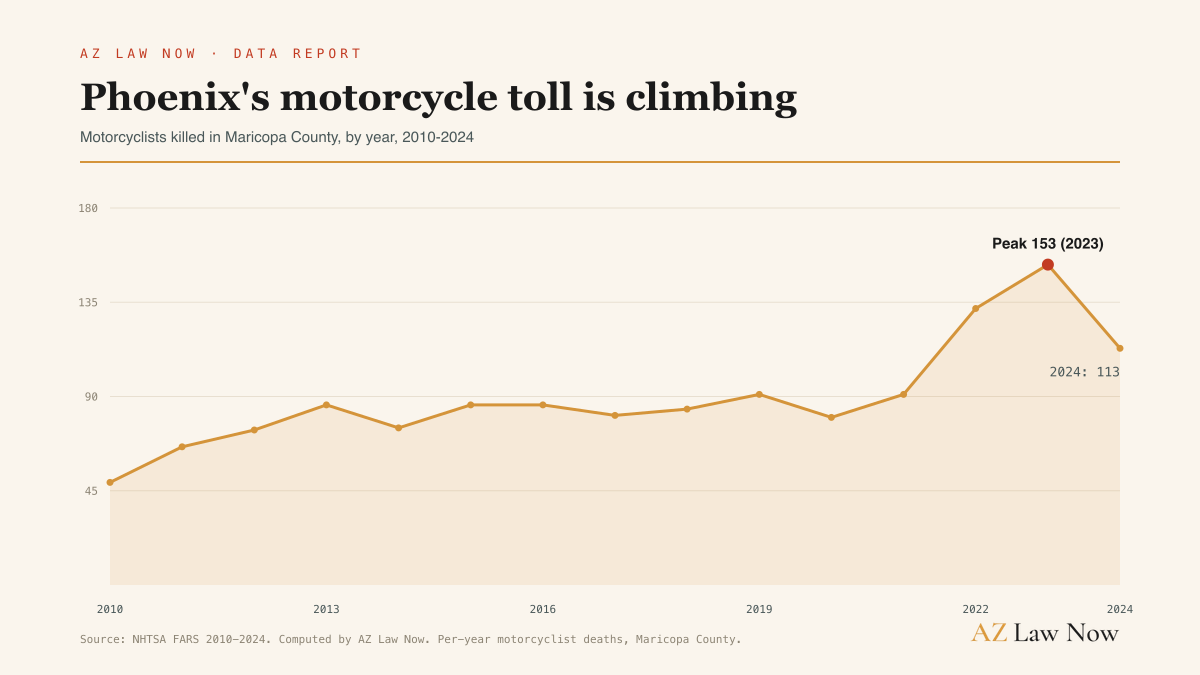
It echoes a pattern we found on foot. Our 25-year pedestrian analysis shows Arizona's pedestrian toll bending sharply upward after 2014, and the motorcyclist line bends the same way over the same years. Whatever changed on these roads, the people most exposed to it, on two wheels or on foot, are the ones paying.
The danger is everywhere, not one corner
Our analysisSome road dangers concentrate. Our pedestrian work found a single corridor, Indian School Road, that outranked every other road in the county. Motorcyclist deaths do not concentrate like that.
Map the 552 fatal motorcycle crash sites from 2020 to 2024 and they spread across the entire valley, on the freeways and the wide arterials alike, from Surprise in the northwest to Chandler in the southeast.
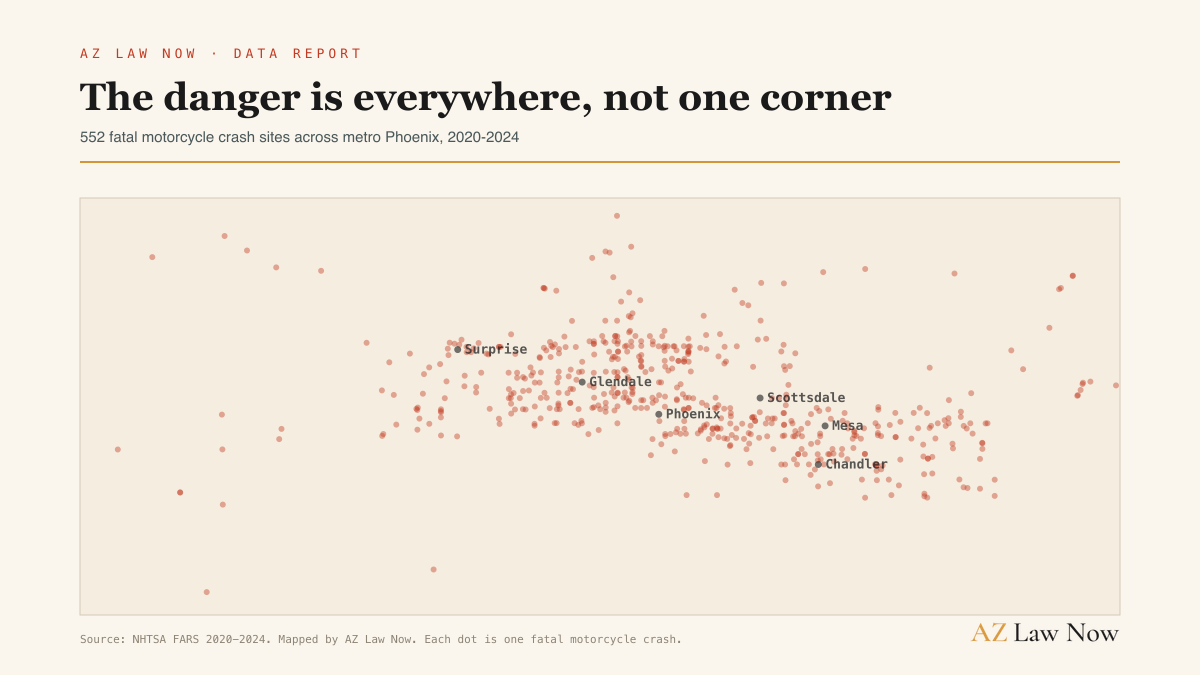
That spread is the finding. There is no single killer intersection to fix. The risk follows the rider across the whole metro, which is why the rate, not any one location, is the story.
Put the three findings together: the deadliest big county in the country to ride, a toll that's still climbing, and a danger that follows the rider everywhere. The rate is the story.
Among the biggest counties in the country, none is deadlier to ride a motorcycle than metro Phoenix, and the gap is widening. Knowing that the risk follows the rider across the whole valley, and that it's growing, protects families and the public.
We read the record so you get answers.
How we built this
Every figure traces to a named federal dataset: NHTSA's FARS, the federal record of every traffic death, for the motorcyclist counts (2010 to 2024), and the US Census Bureau's county population estimates for the denominators. We read the source, not the news write-up.
The per-capita rates and the county ranking are ours. A motorcyclist death is a person killed (fatal injury) on a motorcycle body type, counted at the person level.
We divided the five-year death count by the five-year-average resident population, per 100,000, applied identically to every county. These are not NHTSA-published figures.
A ranking ships only with a transparent, rule-based set. The universe is "the 12 most populous US counties," drawn from Census, and all 12 are shown. We re-tested the #1 against larger and higher-rate counties left out of the top 12, and it holds down to any county above 1.5 million residents.
First, "Phoenix" here means Maricopa County, the core county of the metro, a stand-in for the metro area and not the city limits. Second, the rate is a five-year cumulative count over the five-year-average population, so it reads about five times higher than a single-year rate would.
The same construction is applied identically to every county in the comparison, so the ranking is a fair like-for-like read. The analysis reproduces from a single script over the raw federal files, so any figure can be rebuilt from the record.