Tucson's Second-Deadliest Roads in America
Tucson's roads feel dangerous. Here's the data: among America's cities of 500,000 or more, only Memphis has a higher death rate.
24.95 DEATHS PER 100,000 RESIDENTS A YEAR.
We read the crash record the way we read a case: the people, the rate, and the pattern underneath them.
AZ Law Now pulled the federal fatality record and the Census population counts and computed the per-capita traffic death rate ourselves, for Tucson and Pima County against every comparable city and county in the country. It names no one and sells nothing. It just shows the work.
Of every big US city, only Memphis is deadlier to drive
Our analysisWe ranked every US city with 500,000 or more residents by traffic deaths per resident, 2020 through 2024, and only one city came out deadlier: Memphis. Tucson's rate, 24.95 deaths per 100,000 residents a year, ranks #2 of 37 big US cities.
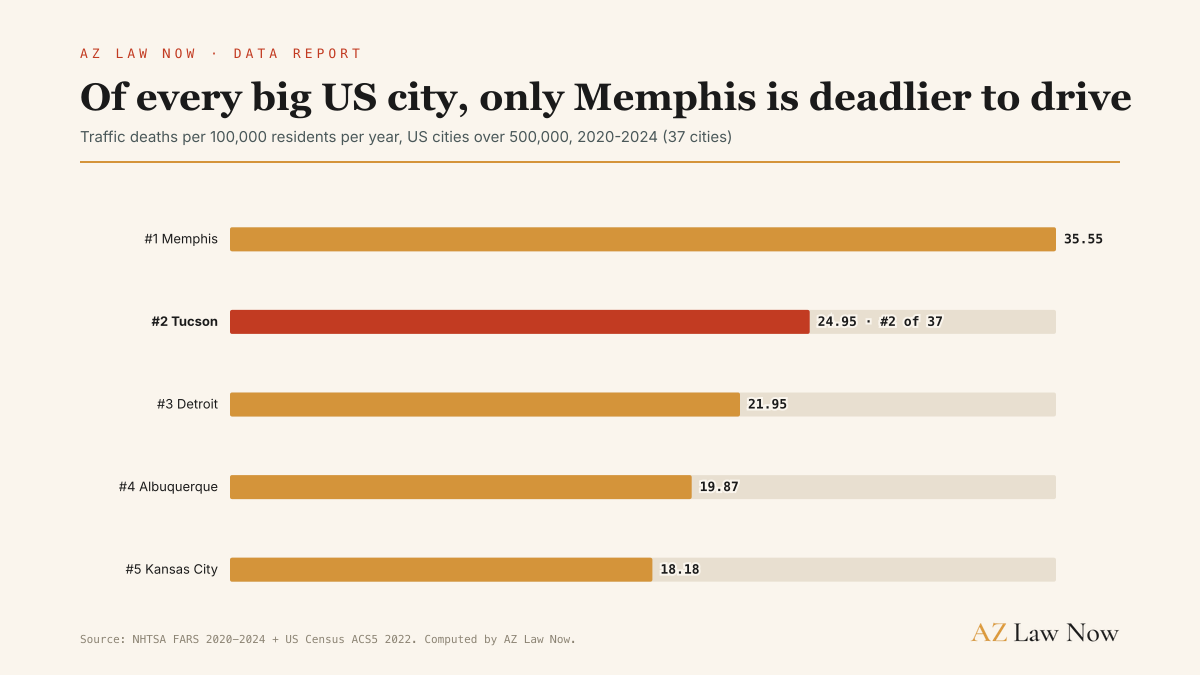
We hold the comparison to cities of 500,000 or more on purpose. It's a fair peer group, big enough that a handful of crashes can't swing the rate, and Tucson still lands second from the bottom among genuine big cities. If you drive in Tucson, you're driving on some of the most dangerous big-city roads in America.
"Every US city with 500,000 or more residents" is a transparent, rule-based set, drawn straight from Census population, not a list we hand-picked to put Memphis on top and Tucson second.
Of 336 Census places above 100,000 residents, 324 matched cleanly to a federal crash record. Thirty-seven of those clear the 500,000 floor, and Tucson ranks second across every one of them.
Pima's motorcyclists die at a higher rate than Maricopa's
Our analysisZoom into the county around Tucson, and a common assumption about Arizona's biggest cities breaks down. Pima County's motorcyclist death rate, 12.82 per 100,000 residents from 2020 to 2024, is higher than Maricopa's 12.48.
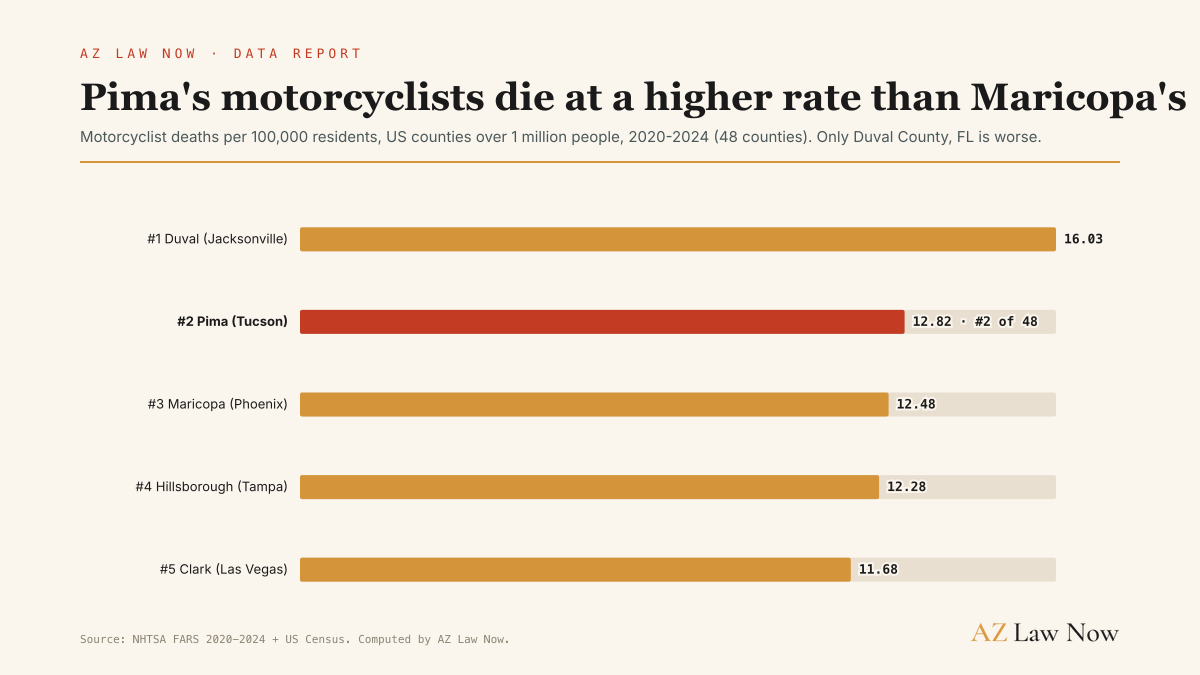
Metro Phoenix is more than four times the size of metro Tucson, so it's easy to assume Maricopa's roads are the more dangerous ones for motorcyclists. They're not. Pima recorded 136 motorcyclist deaths over five years against Maricopa's 569, a smaller county with a smaller population proving just as dangerous, and by this measure more dangerous, for the people riding on two wheels.
More than half of Tucson's deaths are outside a car
Our analysisCut Tucson's death toll a different way, not by rank against other cities, but by who is actually dying on these streets. More than half the people killed here weren't inside a car.
From 2020 through 2024, 365 of Tucson's 675 traffic deaths, 54 percent, were pedestrians, motorcyclists, or cyclists: 210 pedestrians, 116 motorcyclists, and 39 cyclists. The remaining 310 deaths were people riding inside a vehicle.
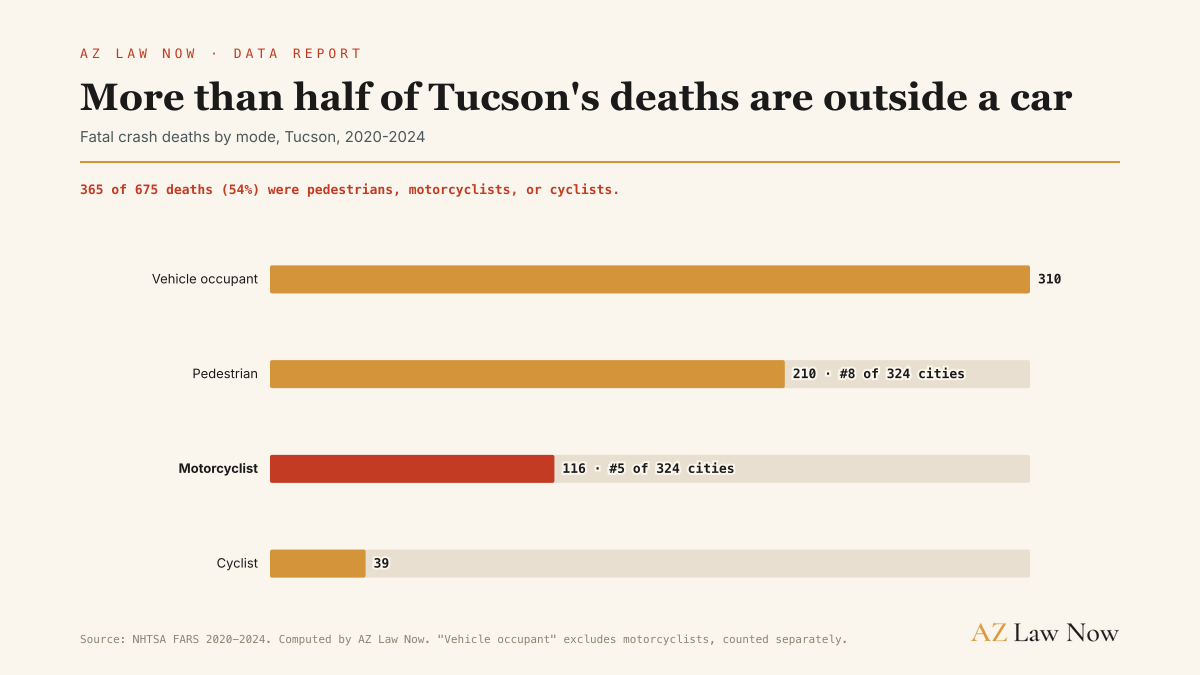
If you walk, bike, or ride a motorcycle in Tucson, this is the risk you're taking on: more than half of everyone these roads killed between 2020 and 2024 was someone outside a car, not behind a windshield.
Tucson's traffic deaths have roughly doubled
Our analysisThis isn't a new normal Tucson has always lived with. It's recent, and it's getting worse. From 2016 through 2019, an average of 71.25 people died on Tucson's roads each year. From 2020 through 2024, that average jumped to 135 a year, nearly double.
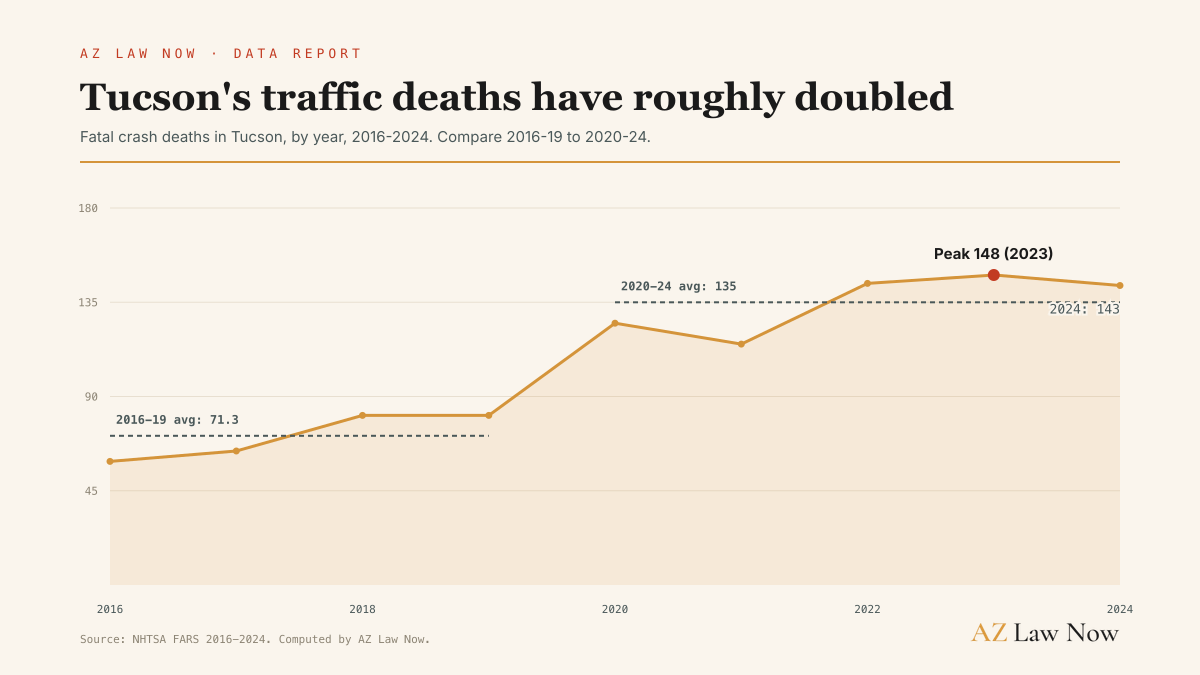
We can't say for certain why the increase happened. The federal fields that used to track contributing factors like speeding or distraction stopped being recorded nationally starting in 2020, a gap in the federal record itself, not a question we chose to skip. What the numbers do show, without question, is that this isn't a one-year spike. It's held for five years running.
Put the four findings together: America's second-deadliest big city to drive in, a county where motorcyclists now die faster than in metro Phoenix, a toll where more than half the dead were never in a car, and a five-year climb that shows no sign of reversing. The rate is the story.
Among America's biggest cities, only Memphis is deadlier to drive in than Tucson, and Pima County's motorcyclists now die at a higher rate than Maricopa's. Knowing where the risk concentrates, and that it isn't slowing down, protects families and the public.
We read the record so you get answers.
How we built this
Every figure traces to a named federal dataset: NHTSA's FARS, the federal record of every traffic death (2016 to 2024, 2020 to 2024 for the rate comparisons), and the US Census Bureau's American Community Survey 5-year estimates for the denominators. We read the source, not the news write-up.
The per-capita rates and rankings are ours. A motorcyclist, pedestrian, or cyclist death uses the federal person-type and body-type codes, counted at the person level.
We divided the five-year death count by the resident population, per 100,000, applied identically to every city and county. These are not NHTSA-published figures.
The big-city ranking covers every US place with 500,000 or more residents, 37 of 324 matched cities. The motorcyclist ranking covers every US county with 1 million or more people, 48 counties. Tucson is FARS city code 530, distinct from South Tucson and Corona de Tucson.
First, the rate is a five-year cumulative count over the resident population, so it reads about five times higher than a single-year rate would. Second, we tried to pull what's driving the increase, speeding, distraction, and similar factors, and couldn't: those federal fields stopped being recorded nationally in 2020, a gap in the record itself, not something we chose to omit.
The same construction is applied identically to every city and county in this report, so each ranking is a fair like-for-like read. The analysis reproduces from the raw federal files, so any figure can be rebuilt from the record.