
The Arizona Department of Health Services reviews every child who dies in this state. A panel reads the file, reconstructs what happened, and answers one question above all the others: could this death have been prevented?
For child drownings, the answer keeps coming back the same. Yes. Every time.
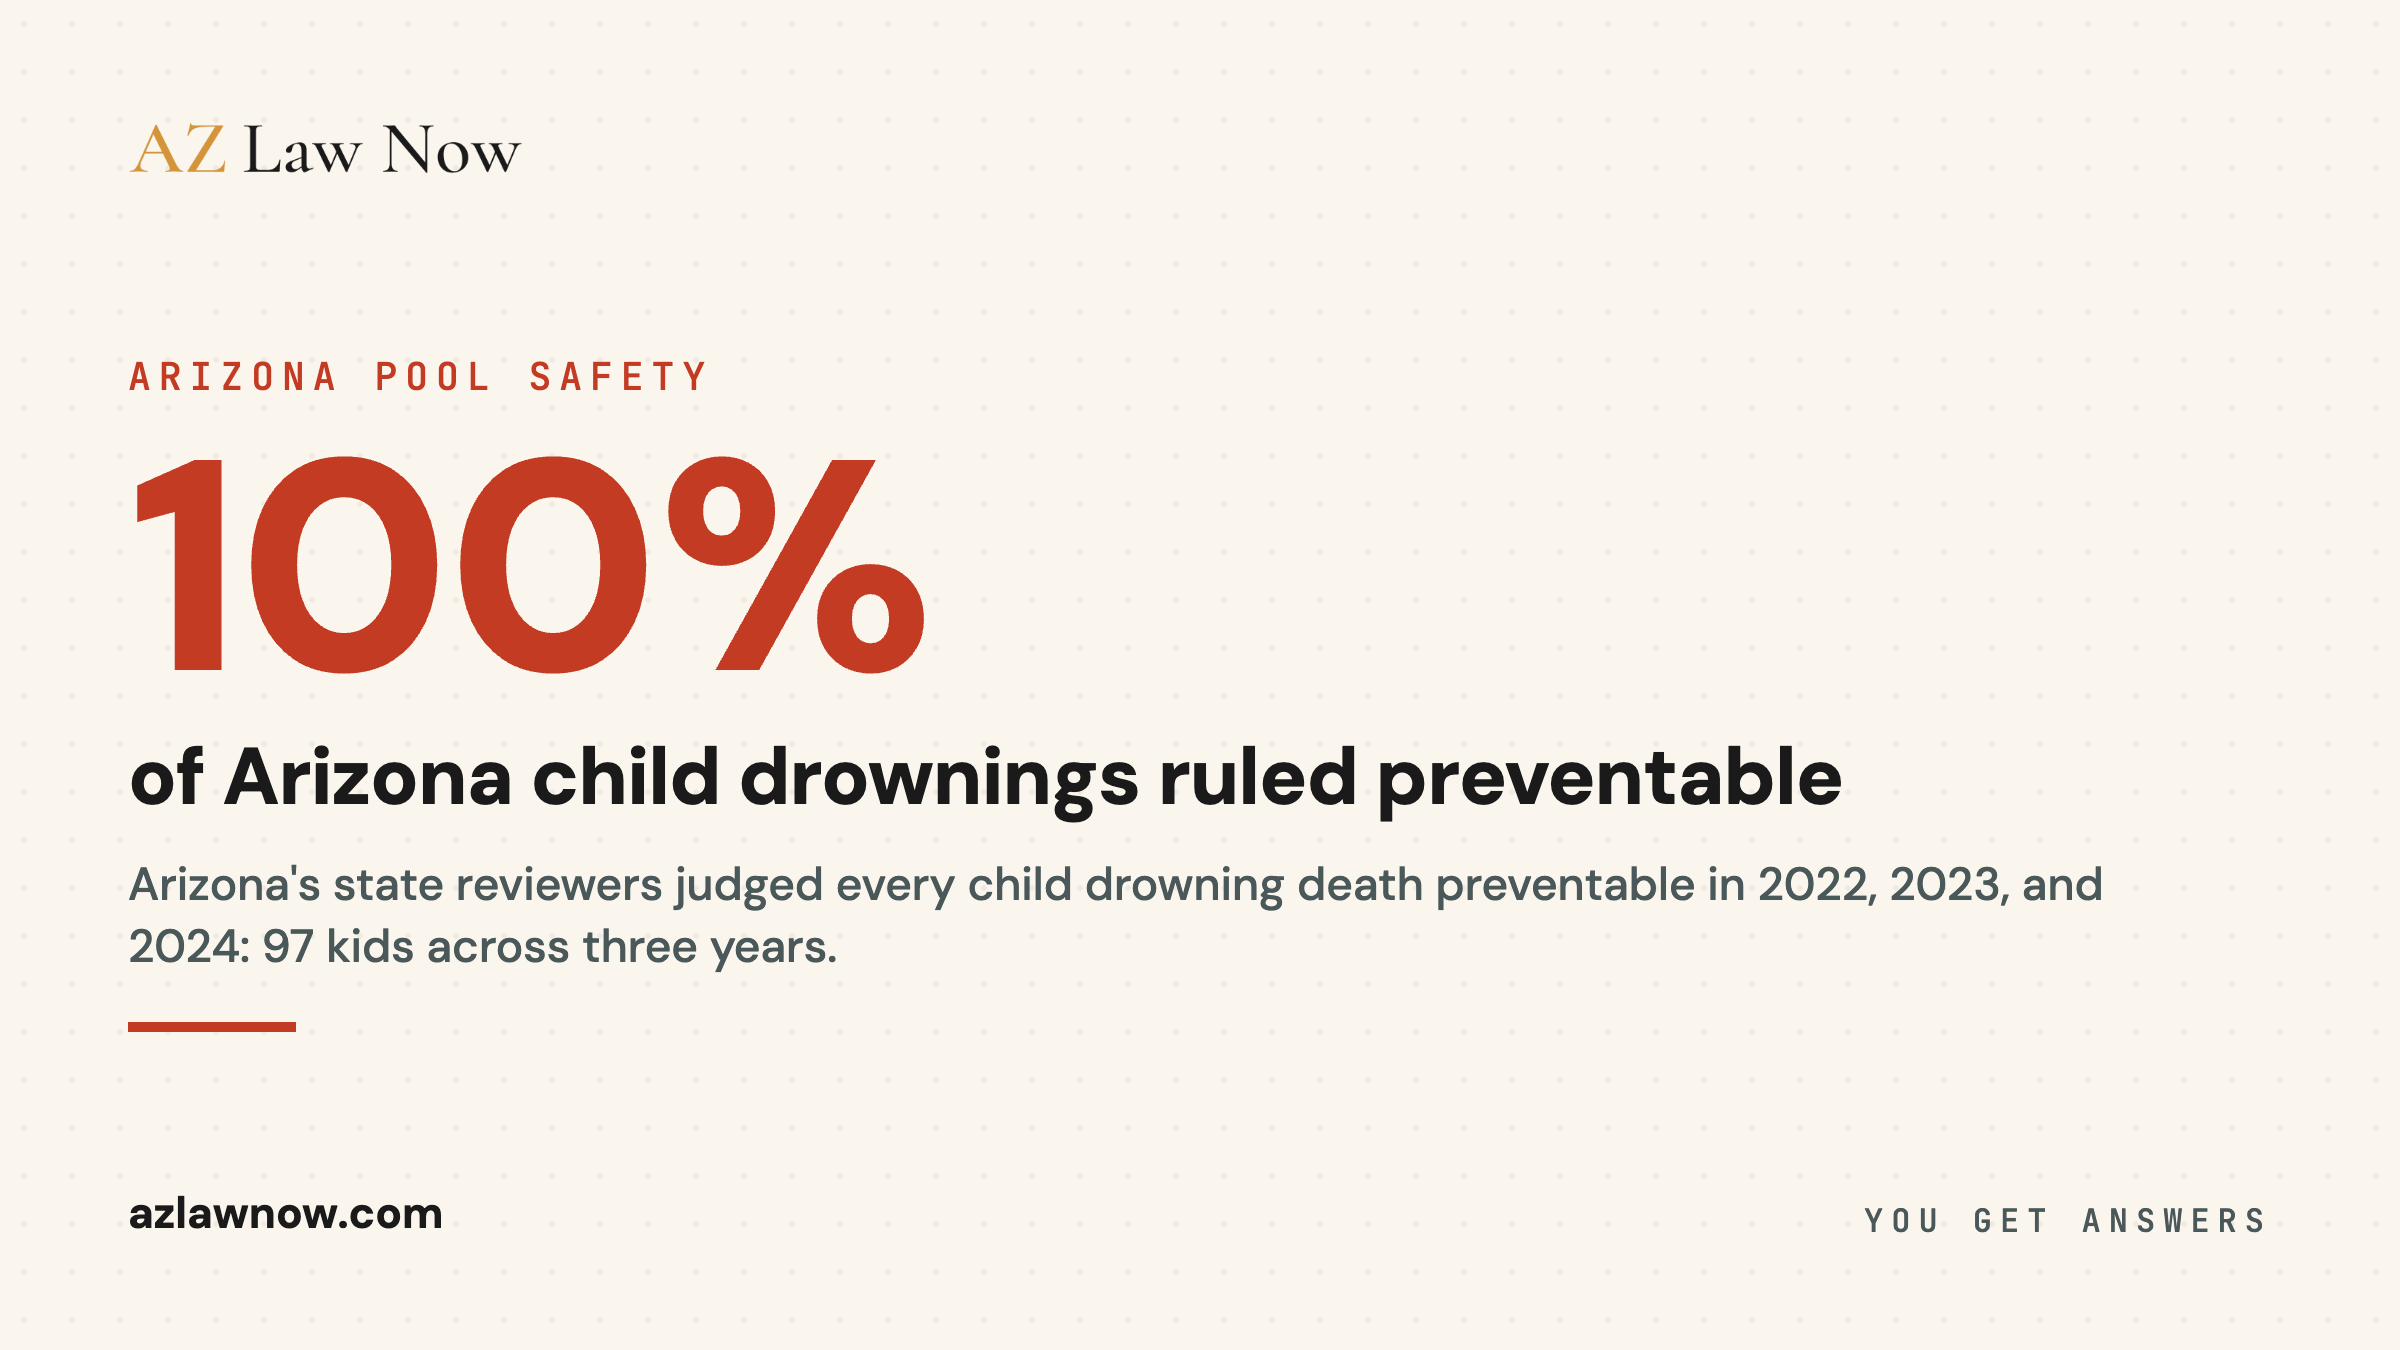
In 2024, Arizona’s Child Fatality Review Program reviewed 36 child drowning deaths. It judged 100% of them preventable. It did the same for the 31 deaths in 2023, and the 30 in 2022.
Three years running, the people whose job is to study how Arizona’s children die have concluded that not one of these drownings had to happen.
That finding is where this report lives.
The Headline the State Won’t Put on a Billboard
Drowning was the leading cause of death for Arizona children ages 1 through 4 in both 2023 and 2024. Not a leading cause. The leading cause, ahead of disease, ahead of every other category the reviewers track.
The 2024 numbers are stark on their own. Of the 36 children who drowned, 75% were under age 5. Three out of four died in a pool, hot tub, or spa. The statewide child drowning mortality rate climbed to 2.2 per 100,000 children, up from 1.9 the year before.
And the reviewers judged every one of those 36 deaths preventable.
Set against the national picture, Arizona’s child drowning rate runs well above the country’s overall rate. The CDC’s most recent published national rate for unintentional drowning across all ages is roughly 1.2 to 1.4 per 100,000. Arizona’s 2024 child rate of 2.2 per 100,000, ages 0 to 17, sits well above that all-ages figure.
We’re deliberately not hanging a single multiplier on it, because the ratio depends on which national age group you line up against and the cohorts don’t match cleanly.
The defensible statement is the plain one: Arizona’s children drown at a rate well above the national all-ages figure, in the state where a backyard pool is the default.
A note on the table. The 2022 column carries the figure that travels widest in news coverage: a lapse in supervision was identified as a factor in 97% of that year’s child drowning deaths. That 97% is real, but it belongs to 2022.
The most recent figure, for 2024, is 81%. Across the three most recent review years, a lapse in supervision was a factor in 81% to 97% of Arizona child drowning deaths. The pattern is the story. The single number depends on the year.
The 21-Year Map Behind the Record Year
When AZFamily reported that child drownings had hit their highest in over a decade across Maricopa and Pinal, it named a single-year record. The record has a backstory the yearly headlines never show.
We read 21 years of Valley fire-department water-incident reports, every emergency water call logged across the two counties from 2005 through 2025, as one dataset instead of 21 separate years. The map that comes out answers two questions a record year can’t: where the calls concentrate, and whether the outcomes are getting worse.
One note on what this counts. These are water-incident emergency responses of every age, not only the child deaths the state reviews. Child drownings are the sharpest edge of this larger pattern, not the whole of it. We’re keeping the two straight on purpose.
The full dataset behind this section, the department-by-department crosswalk, the year-by-year record, and the Pima County series, lives in our standalone Arizona Drowning Map data report, every figure free to use with credit.
One department carries nearly half of it. Across 3,252 water-incident responses over 21 years, the Phoenix Fire Department alone answered 1,414 of them, 43.5% of every logged call in the two counties. Add the next four busiest jurisdictions and five departments account for 73.8% of everything.
That’s not spread evenly across a metro area of almost five million people. It concentrates.
The concentration only holds up when the math is shown, so here’s the math. A few departments appear in the archive under more than one name across 21 years of renames. We merged those labels and show exactly which ones combine, so anyone can re-add the column themselves.
That’s a response-volume map, not a fatality-rate ranking. It says which departments field the most calls, not which neighborhoods the water sits in. More on that limit below.
The second question is the one every record-year headline dodges: is this actually getting worse? Compare the first five years of the archive to the last five. Raw call volume didn’t climb. It fell.
Read the bottom row. Water-incident responses dropped 7.4% between the two windows, but fatal outcomes rose 23.8%. The share of water calls that end in death climbed from 31.7% to 42.4%, more than ten percentage points, even as the raw number of calls went down. Fewer incidents, deadlier ones.
That’s the opposite of a problem solving itself.
Any single drowning case turns on one property and one barrier. The 21-year map shows the pattern the individual cases sit inside: the same water hazards, the same responding jurisdictions, year after year, with outcomes worsening. That’s the backdrop the pool-barrier law and the attractive-nuisance doctrine below were written to address.
Now the honest limit. This data names the responding fire department, not the block. Its grain is jurisdiction, a Phoenix Fire coverage area that spans a huge and varied slice of the city, not a zip code or a neighborhood. So we can tell you which department answers the most calls.
We can’t yet tell you which streets the water sits on.
No public dataset breaks these responses below the fire-department level. The finer cut, the one that would tie incidents to specific addresses, pool permits, or barrier-compliance records, needs hospital-discharge and permit data we’re still assembling. When we have it, that’s a separate map.
This one stops at the jurisdiction line, and we’d rather say so than imply a precision we don’t have.
What “Preventable” Means in the File
When the review program calls a death preventable, it’s making a specific finding, not a moral judgment. It means the panel identified a concrete intervention, a barrier, a layer of supervision, a swim skill, that would have changed the outcome. The most common gap it names is supervision.
That word does heavy lifting in a legal context. A drowning is fast and silent. A toddler can slip through an open door, cross a yard, and be in the water in under a minute, with no splash and no cry to mark it.
The review program’s finding that supervision lapsed in 81% of 2024 cases isn’t an accusation that parents were careless. It’s a description of how thin the margin is, and of how much rides on the layers that are supposed to catch a lapse before it turns fatal.
The most important of those layers is a fence.
The Pool-Barrier Law: A.R.S. 36-1681
Arizona wrote the duty into statute. A.R.S. 36-1681 governs pool enclosures, and it applies to any swimming pool or contained body of water deeper than 18 inches and wider than 8 feet that is intended for swimming.
The statute is specific about what a compliant barrier looks like.
The statute carves out exceptions, including agricultural structures, public and semi-public pools, pools built before the law took effect, residences where every occupant is age 6 or older, and jurisdictions with local ordinances at least as strict.
A violation is charged as a petty offense, and the penalty can be waived if the owner installs a compliant barrier within 45 days and completes a pool safety course.
That petty-offense label undersells the law’s reach. In a civil case, a violation of A.R.S. 36-1681 can establish negligence, because the statute sets a standard of care the legislature already decided was reasonable. The barrier requirement isn’t just a code item. It’s the line the state drew between a private hazard and a public duty.
Local codes can draw that line tighter. Unincorporated Maricopa County, under its 2018 building-code additions, requires a 60-inch barrier, a 54-inch latch, gates that swing away from the pool, and a separate barrier between any door that opens directly onto the pool and the water itself.
Property owners should confirm the rule that governs their exact address, because the jurisdiction, not the statewide floor, sets the controlling standard.
When the Hazard Belongs to Someone Else: Attractive Nuisance
A pool is the textbook example of what the law calls an attractive nuisance: a manmade condition that draws young children who are too little to understand the danger.
Arizona has adopted Section 339 of the Restatement (Second) of Torts, the framework that governs these cases. It can make a property owner liable when a trespassing child is harmed by an artificial condition, even though the same owner would owe an adult trespasser almost nothing. The doctrine turns on five elements:
- The owner maintains an artificial condition, like a pool, that the owner knows or has reason to know is likely to attract children.
- The owner knows or should know the condition poses a substantial risk of serious harm to children.
- Because of their youth, the children can’t appreciate the danger.
- The burden of eliminating the danger is slight compared to the risk to children.
- The owner failed to exercise reasonable care to protect the children.
The fourth element is where the pool-barrier statute and the common-law doctrine meet. A fence is cheap measured against a child’s life, and the legislature already set the standard for what an adequate one looks like.
When a child wanders to a neighbor’s unfenced pool and drowns, the attractive nuisance framework asks whether that owner did the little it would have taken to prevent it. That question, what duty a property owner owed to keep the water safe, is the core of premises liability in Arizona.
Arizona’s Supreme Court adopted the attractive-nuisance framework in MacNeil v. Perkins, 84 Ariz. 74, 324 P.2d 211 (1958).
The Court of Appeals applied it to a backyard pool in Giacona v. Tapley, 5 Ariz. App. 494, 428 P.2d 439 (1967), where a young child reached a neighbor’s pool through an inadequate barrier and drowned, and the court allowed the attractive-nuisance claim to proceed.
The doctrine is well settled in Arizona, which is the load-bearing point here.
Wrongful Death and the Clock: A.R.S. 12-611, 12-612, and the Two-Year Window
When a child drowns because of someone else’s failure, Arizona’s wrongful death statutes set out who can sue and on what theory.
A.R.S. 12-611 creates the cause of action. Liability attaches when a death is caused by a wrongful act, neglect, or default that would have supported a damages claim had the person survived, and it attaches even if the same conduct also amounts to a homicide.
A.R.S. 12-612 names who may bring the claim: a surviving spouse, a child, a parent or guardian, or the personal representative of the deceased. Either parent can sue for the death of a child, and damages are distributed in proportion to each party’s loss.
The statute disqualifies anyone convicted of child abuse causing the death or of a homicide offense, treating that person as having predeceased the child so they can’t profit from the death.
Then there is the deadline. Arizona gives families two years to file a wrongful death claim under A.R.S. 12-542, and for a fatal injury that clock runs from the date of death.
A parent bringing a wrongful death claim isn’t a minor, so the parent’s two-year window opens at the date of the child’s death and doesn’t wait.
Arizona tolls the statute of limitations for a minor’s own injury claim under A.R.S. 12-502: the clock doesn’t run while a person is under 18, and a surviving minor gets the full two years after turning 18. That tolling protects a child who survives an injury.
It doesn’t extend a parent’s separate wrongful death deadline, which still runs two years from the date of death. Because these rules interact in fact-specific ways, families should confirm their own deadline with a lawyer rather than assume the longest one applies.
Prevention Is the Thing the State Keeps Underlining
Every CFRP annual report lands on the same conclusion: these deaths are preventable, and the layers that prevent them are known. The reviewers’ own findings point to where the gaps are.
In 2024, among pool drowning cases where a barrier was supposed to be in place, the most frequently breached barriers were fences and doors, and a large share of the fence breaches involved no fence at all.
In 2023, the pattern was even sharper: the overwhelming majority of fence breaches that year involved no fence present. The statute that requires a 5-foot barrier exists precisely because the absence of one is the recurring fact in the files.
The defenses stack. A compliant, self-latching barrier between the house and the pool. Doors and windows that a toddler can’t open onto open water. An adult assigned, by name, to watch the water with nothing else competing for their attention. Swim skills for children old enough to learn them.
No single layer is foolproof. The point of layering is that a lapse in one is caught by the next, which is the whole logic behind the review program’s finding that a supervision lapse, the failure of one layer, was a factor in most deaths rather than the only cause.
The Disproportion the Data Won’t Let Go
One finding in the reviews deserves its own line. In 2024, Black children made up 22% of Arizona’s child drowning deaths while making up about 5% of the child population, a roughly fourfold overrepresentation. The 2023 figures were close to the same.
This tracks a national pattern documented by the CDC, and it doesn’t trace to anything about the children. It traces to structural gaps: unequal access to swim lessons, unequal access to safe water settings, and the downstream effects of poverty. A prevention strategy that ignores who is dying disproportionately isn’t a complete one.
What the Record Establishes
Strip the report to its load-bearing facts and this is what Arizona’s own reviewers have put on the record. Drowning is the leading killer of this state’s youngest children. The 2024 count of 36 is the highest in the three most recent years reviewed, up from 31 in 2023 and 30 in 2022.
Three out of four victims were under 5, and three out of four died in a pool or spa. A supervision lapse was a factor in most deaths, and a missing or breached barrier was the recurring physical fact. And in every year reviewed, the panel concluded that 100% of these deaths were preventable.
The state already wrote the standard of care into A.R.S. 36-1681. Arizona courts already recognize that a pool is an attractive nuisance and that the duty can reach a trespassing child. The wrongful death statutes already say who can hold a responsible party to account, and the clock to act is short.
The law, in other words, isn’t the gap. The gap is the fence that was never built, the gate that didn’t latch, the minute no one was watching the water. Arizona’s reviewers have been saying it plainly for years: not one of these children had to drown.
Frequently asked questions
What is the leading cause of death for young children in Arizona?
How many children drowned in Arizona in 2024?
Are most child drownings in Arizona preventable?
What does Arizona's pool fence law require?
Can a homeowner be liable when a child drowns in their pool?
What is the deadline to file a wrongful death claim for a child in Arizona?
Who can bring a wrongful death claim in Arizona?
Sources & references
- Arizona Department of Health Services, Child Fatality Review Program. (2025). 32nd Annual Report (2024 calendar-year data) https://www.azdhs.gov/documents/prevention/womens-childrens-health/reports-fact-sheets/child-fatality-review-annual-reports/cfr-annual-report-2025.pdf
- Arizona Department of Health Services, Child Fatality Review Program. (2024). 31st Annual Report (2023 calendar-year data) https://www.azdhs.gov/documents/prevention/womens-childrens-health/reports-fact-sheets/child-fatality-review-annual-reports/cfr-annual-report-2024.pdf
- Arizona Department of Health Services, Child Fatality Review Program. (2023). 30th Annual Report (2022 calendar-year data) https://www.azdhs.gov/documents/prevention/womens-childrens-health/reports-fact-sheets/child-fatality-review-annual-reports/cfr-annual-report-2023.pdf
- Arizona Department of Health Services, Child Fatality Review Program. (2022). 29th Annual Report (2021 calendar-year data) https://www.azdhs.gov/documents/prevention/womens-childrens-health/reports-fact-sheets/child-fatality-review-annual-reports/cfr-annual-report-2022.pdf
- Arizona State Legislature. ARS 36-1681: Pool Enclosures https://azleg.gov/ars/36/01681.htm
- Arizona State Legislature. ARS 12-611: Wrongful Death; Liability https://azleg.gov/ars/12/00611.htm
- Arizona State Legislature. ARS 12-612: Wrongful Death; Parties Plaintiff; Distribution https://azleg.gov/ars/12/00612.htm
- Arizona State Legislature. ARS 12-542: Statute of Limitations; Personal Injury and Wrongful Death https://azleg.gov/ars/12/00542.htm
- Arizona State Legislature. ARS 12-502: Tolling of Limitations for Minors https://azleg.gov/ars/12/00502.htm
- Maricopa County Planning and Development. Pool Barrier Requirements (2018 IBC Local Additions, Section 3109) https://www.maricopa.gov/DocumentCenter/View/69465/Pool-Barrier-Requirements
- CDC. MMWR Vital Signs: Drowning Death Rates, 2019-2023 https://www.cdc.gov/mmwr/volumes/73/wr/mm7320e1.htm
- CDC. Drowning Facts https://www.cdc.gov/drowning/data-research/facts/index.html
- CDC, National Center for Health Statistics. Data Brief 413: Unintentional Drowning Deaths Among Children Aged 0-17, 1999-2019 https://www.cdc.gov/nchs/products/databriefs/db413.htm
- AZFamily / Children's Safety Zone. (2025). Child drownings reach highest in over a decade in Maricopa and Pinal Counties https://www.azfamily.com/2025/05/27/child-drownings-reach-highest-over-decade-maricopa-pinal-counties/
- Children's Safety Zone. (2025). Water-Related Incidents and Fatalities Archives, Maricopa and Pinal Counties annual reports, 2005 through 2025 https://childrensafetyzone.com/water-related-incidents-fatalities-archives/