Phoenix Personal Injury Lawyers
Arizona's largest city. The most dangerous intersections in the Valley. We build cases on ADOT data and MAG crash reports. Contingency representation.
Free, no obligation. Available 24/7. No attorney fee unless we win. Case costs may apply.
- $3.07M+ Recovered for Arizona families
- 5.0 ★ 154 verified Google reviews
- No Fee Unless we win your case
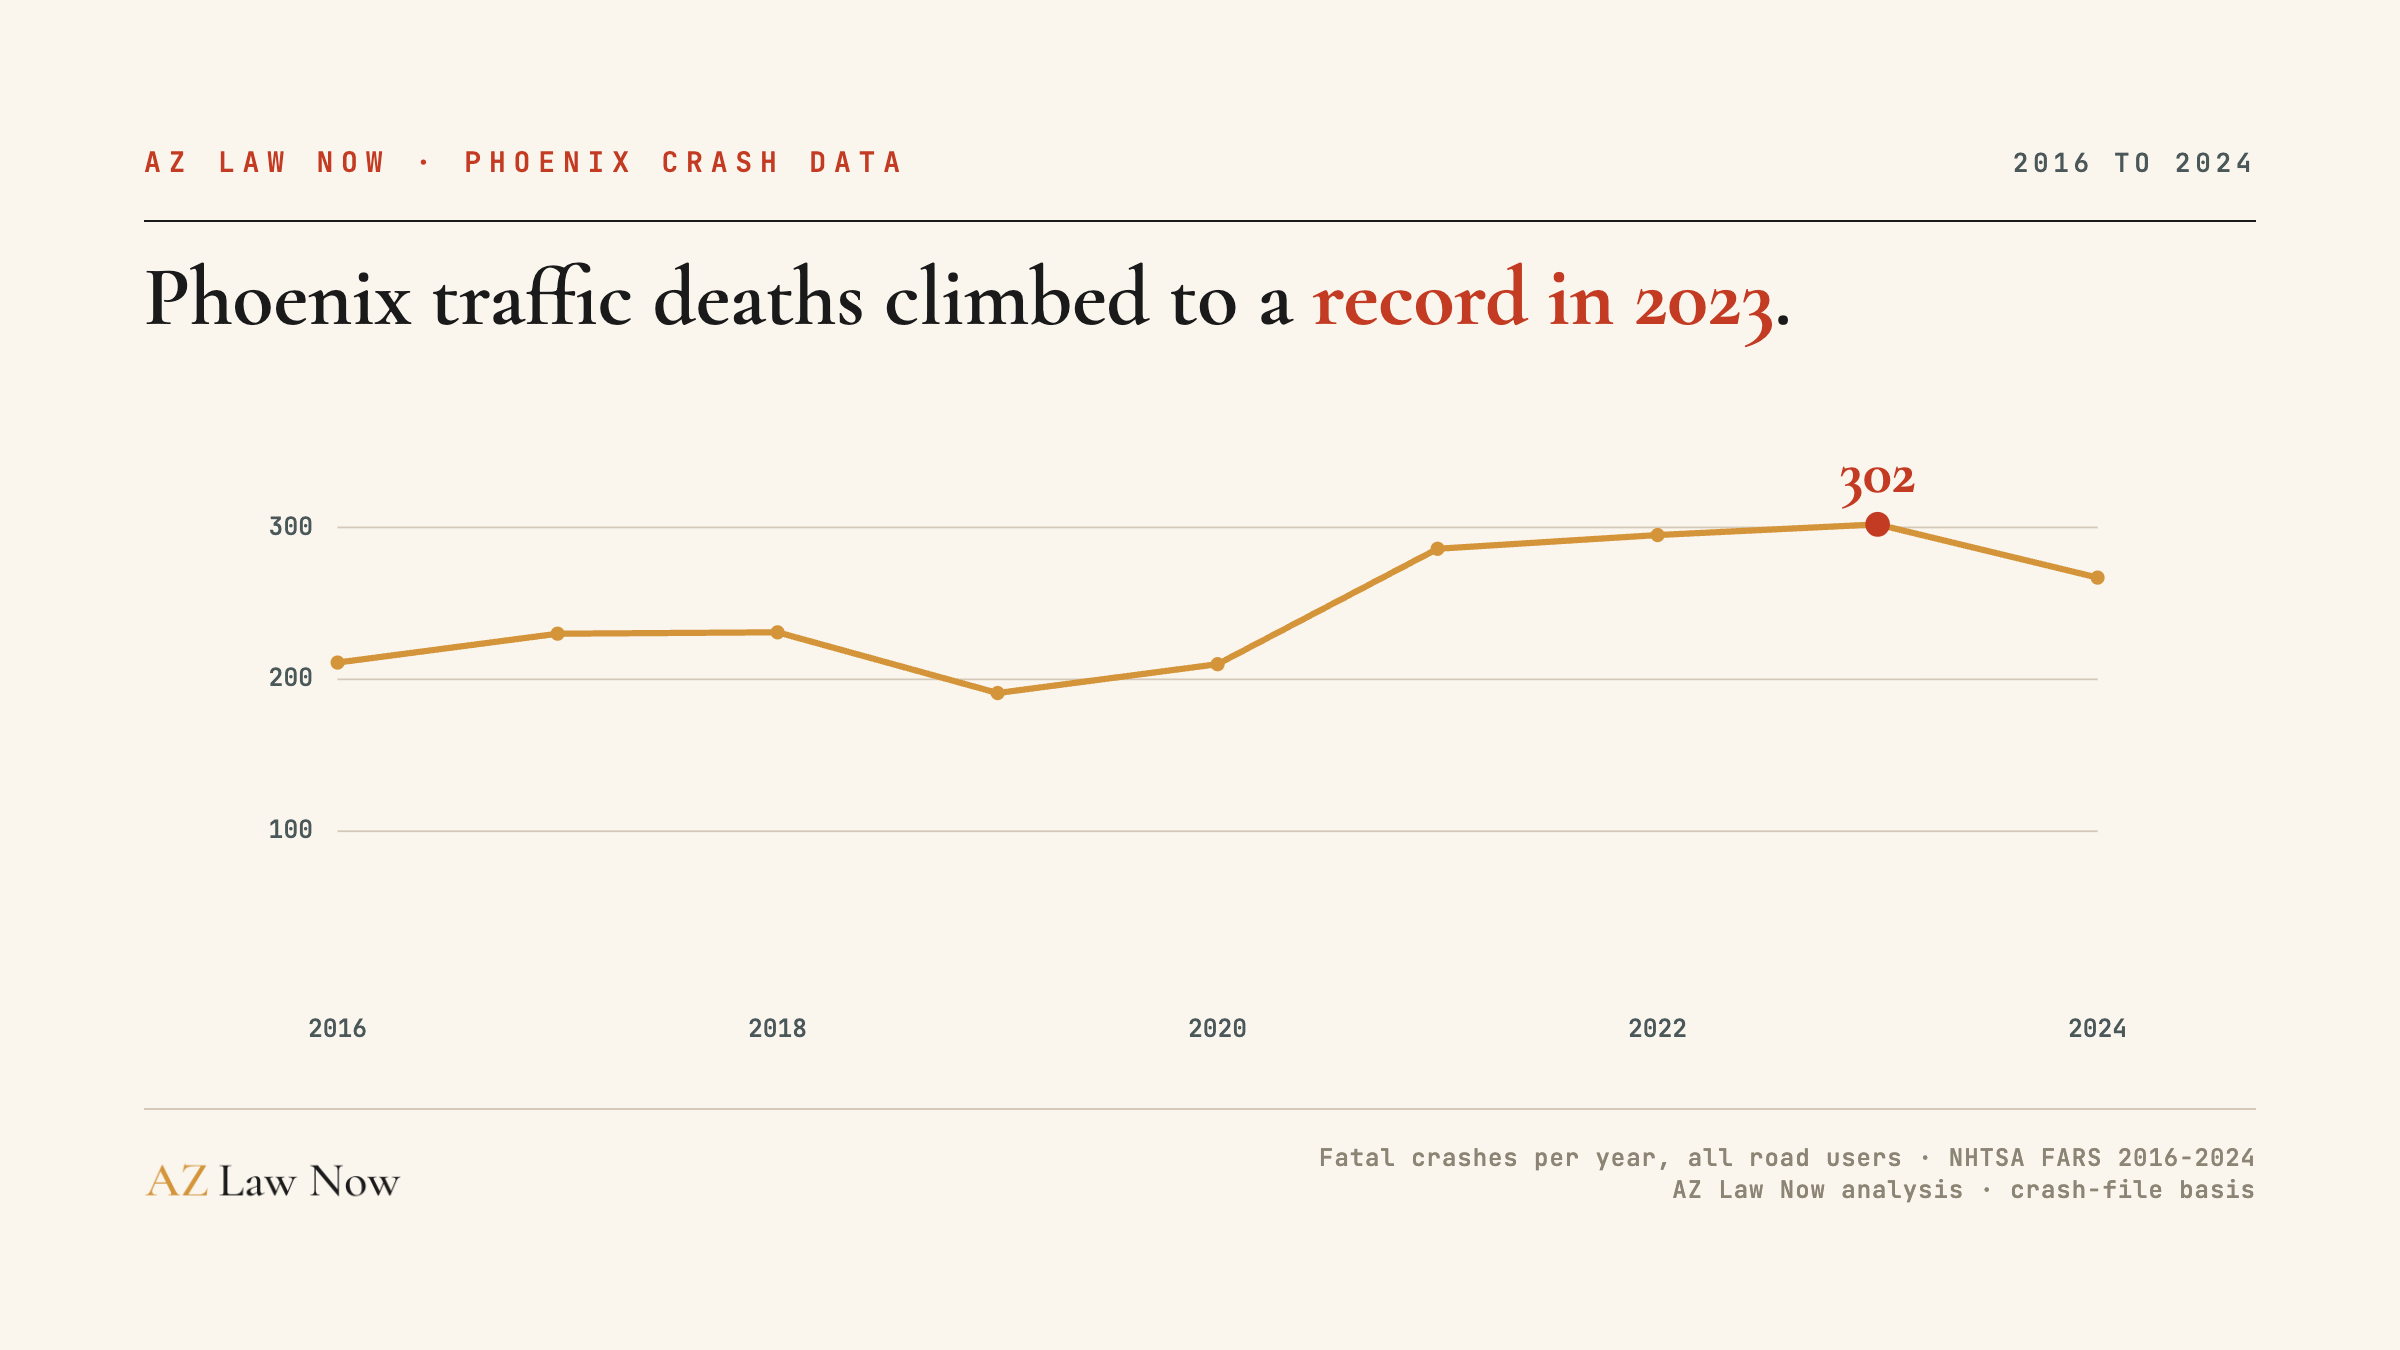
ADOT recorded more than 37,000 crashes in Phoenix in 2024. Federal crash data counts 267 of them as fatal, killing 279 people. That's a traffic death in Phoenix nearly every single day. Across 2016 to 2024, 2,223 fatal crashes killed 2,335 people, more than any other city in the state.
I pull this data from ADOT's Crash Facts report annually. Phoenix is the largest city in Arizona and the fifth-largest in the country. It has more freeways, more intersections, more traffic volume, and more crashes than any other city in the state. Maricopa County accounts for 73 percent of all Arizona crashes. Phoenix accounts for the majority of Maricopa County.
The Most Dangerous Intersections in the Valley
MAG publishes a Top 100 Crash-Risk Intersections list, built on 2018 to 2022 data. Phoenix dominates it. 67th Avenue and McDowell Road ranks first. 51st Avenue and Camelback Road is second. 19th Avenue and Peoria Avenue is third. The pattern is clear: wide, multi-lane arterials on the west and south sides of the city.
These aren't freeways. They're the roads people drive every day. Thomas Road, McDowell Road, Van Buren Street, 35th Avenue, Indian School Road. Seven lanes wide. Continuous turn lanes. Half-mile spacing between signals. Roads designed for throughput. Not for safety. I covered the data in the West Valley dangerous intersections investigation.
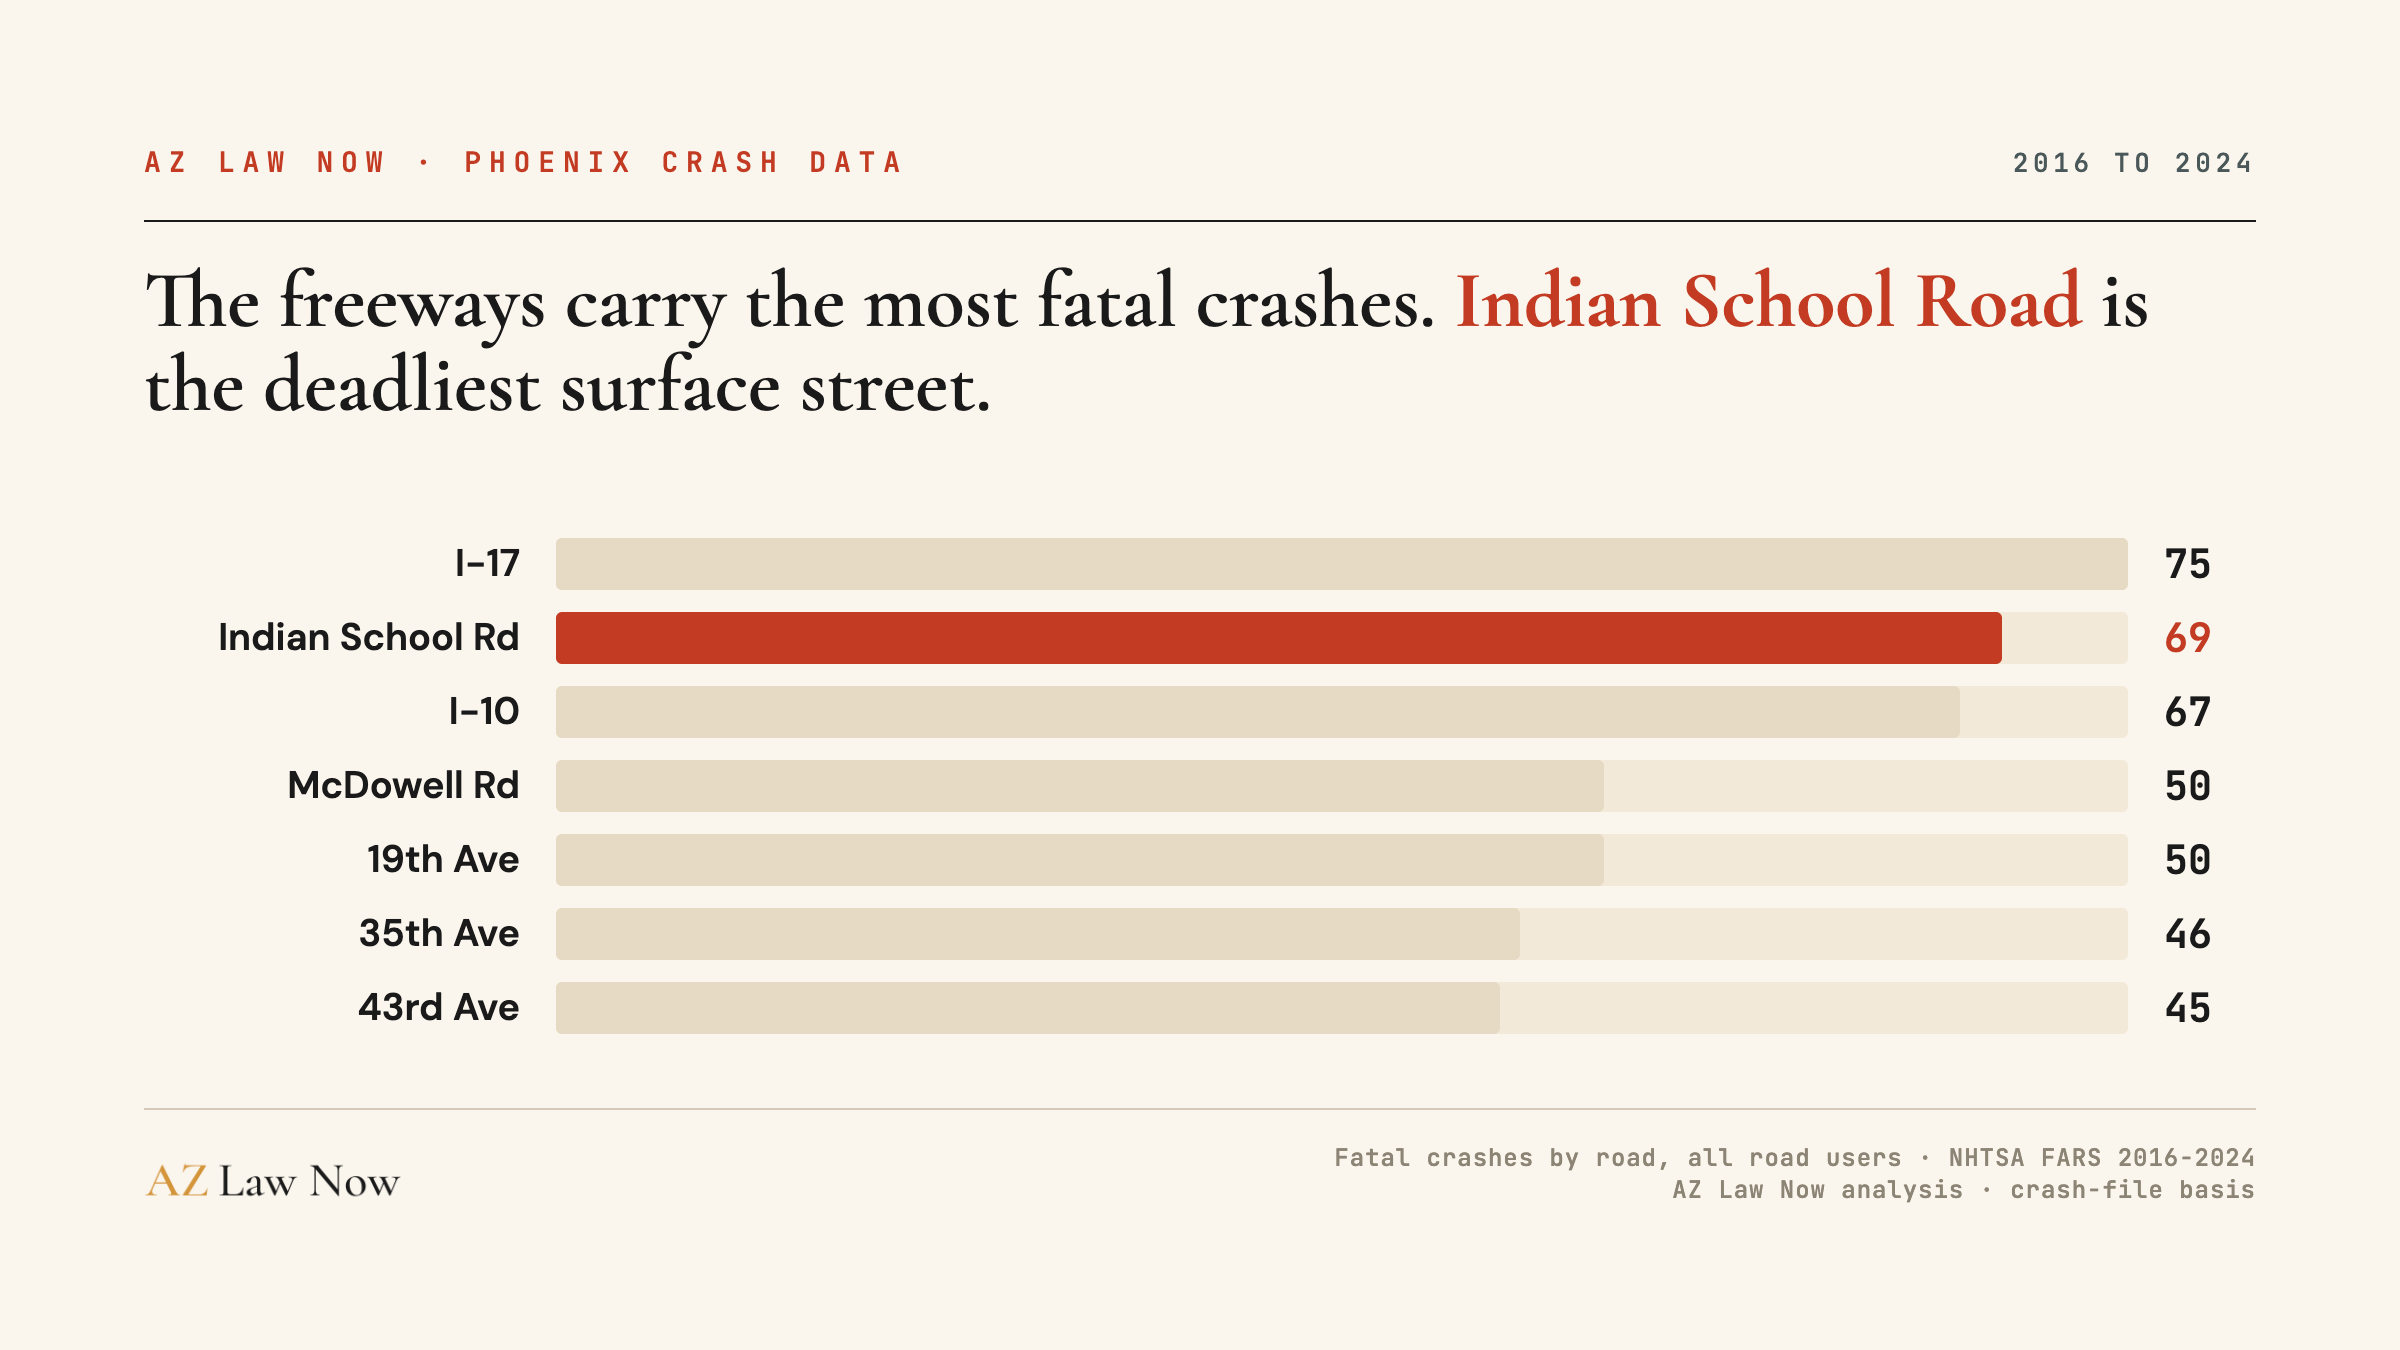
Those are all-crash intersection rankings. When we narrow to fatal crashes from 2016 to 2024, the deadliest corridors come into focus. The freeways lead, but Indian School Road is the deadliest surface street in the city.
Phoenix Leads Arizona in Pedestrian Deaths
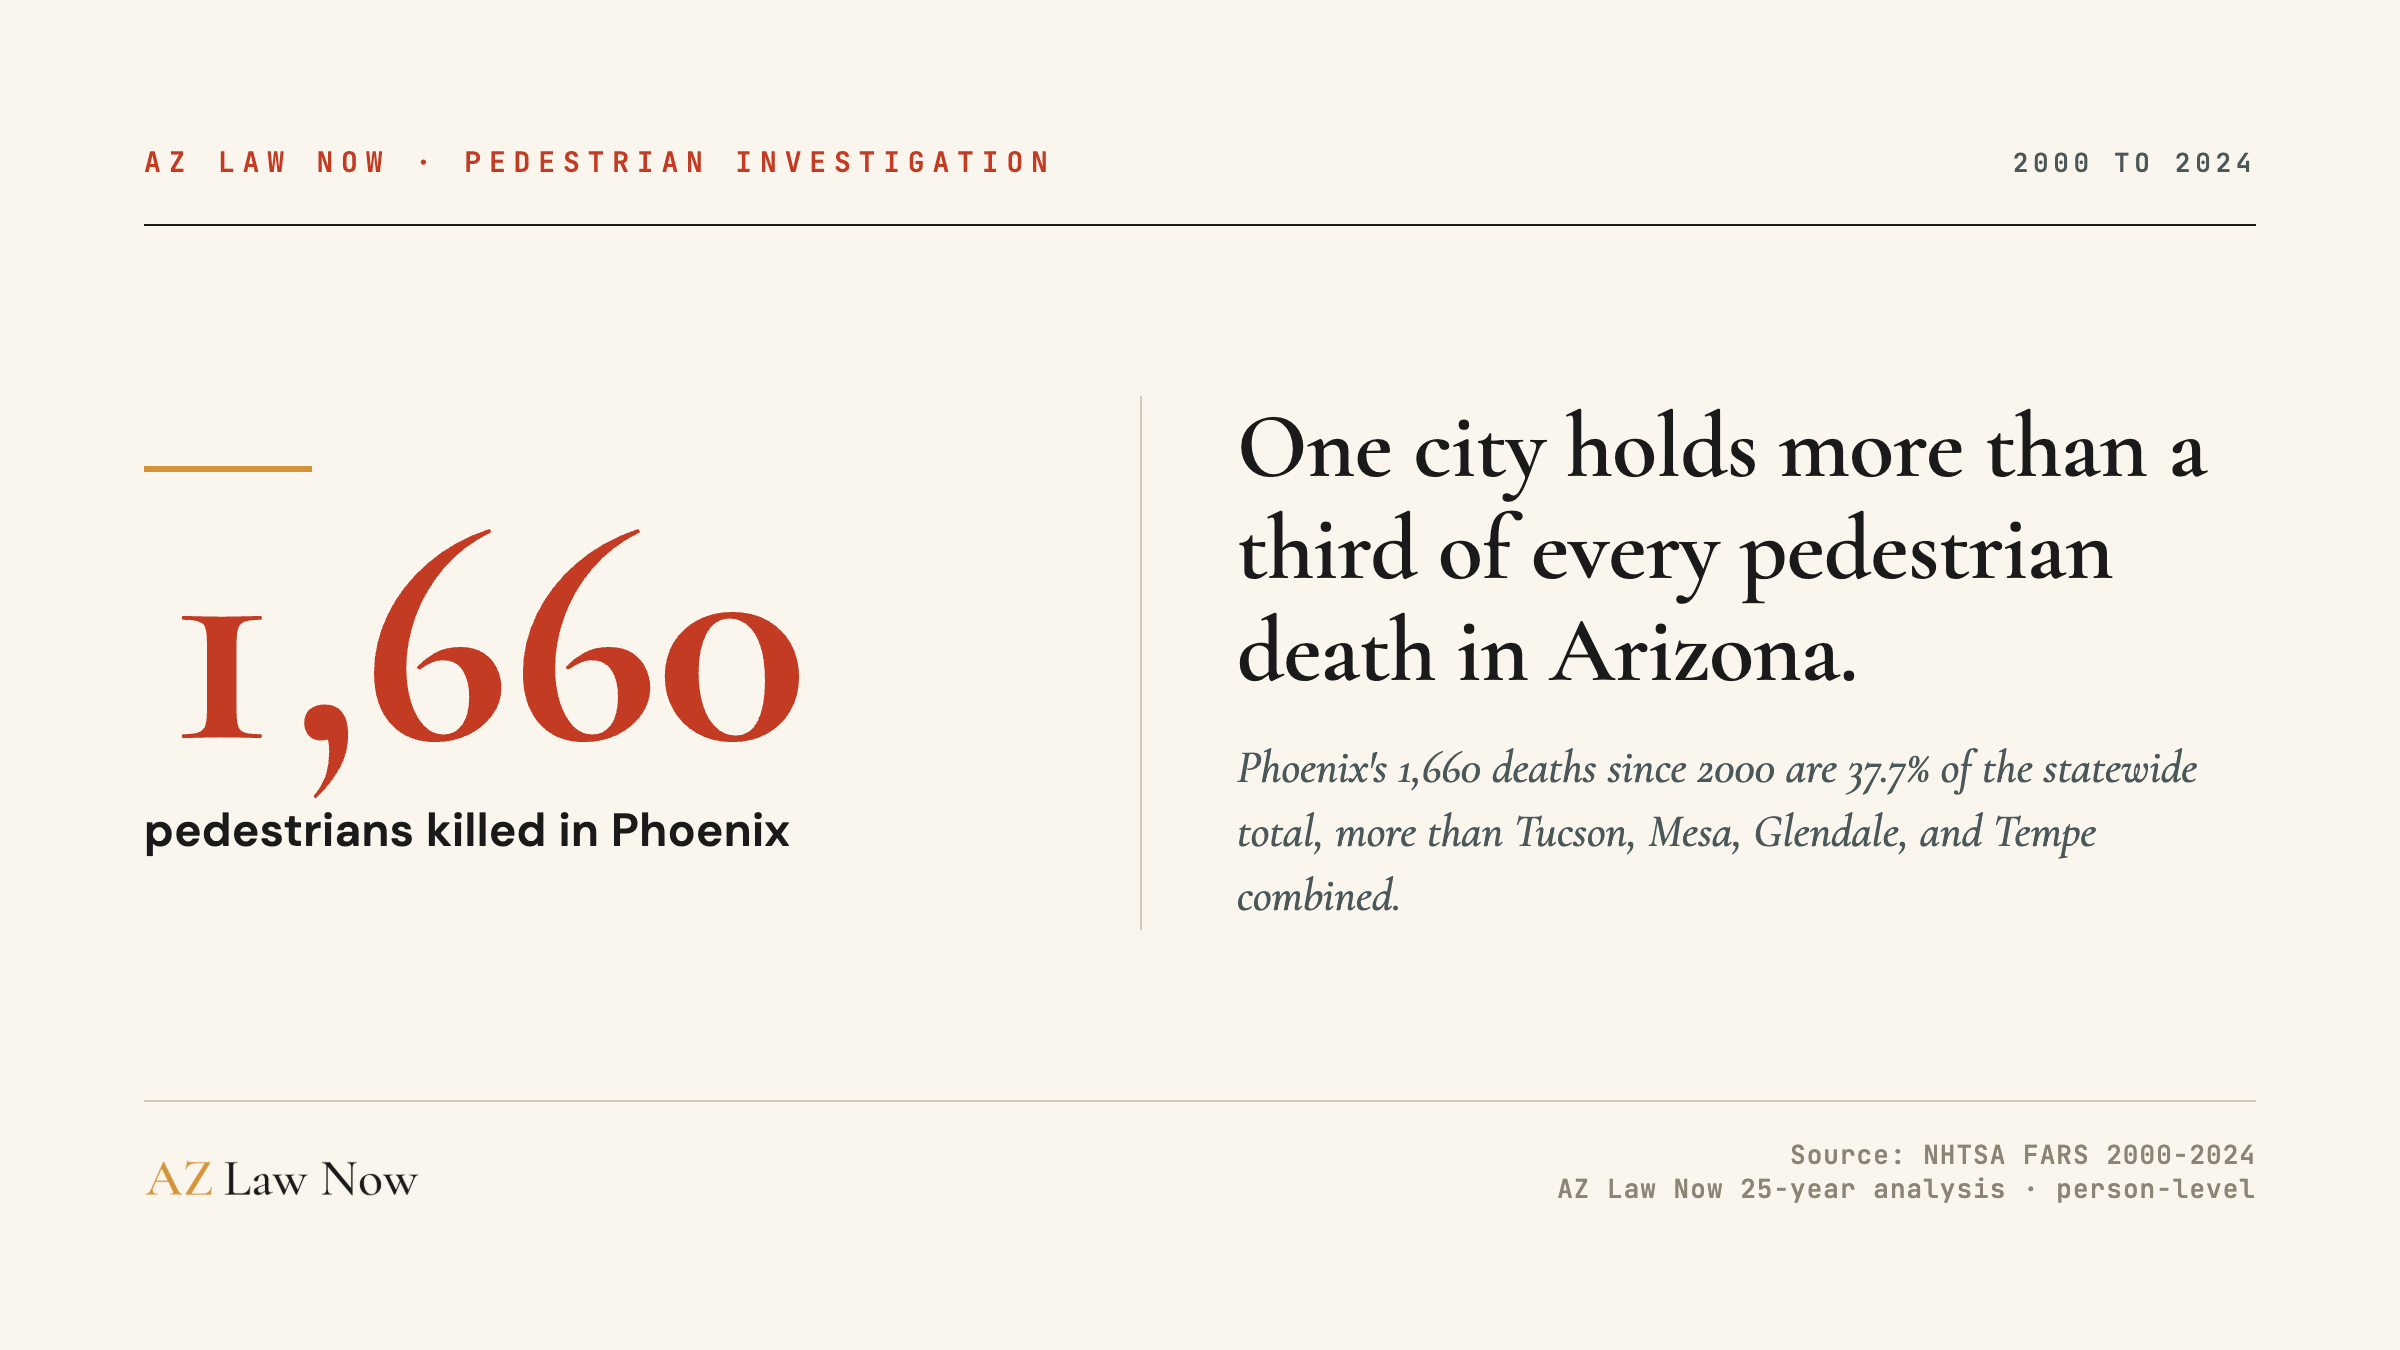
Since 2000, 1,660 pedestrians have been killed in Phoenix. That is 38 percent of every pedestrian death in Arizona, and more than Tucson, Mesa, Glendale, and Tempe combined. More than 900 of those deaths have come since 2015, as the toll climbed. Pedestrians are involved in 44 percent of the city's fatal crashes. The city adopted a Vision Zero Road Safety Action Plan in 2022 and committed $10 million annually. Three years in, the death count hasn't meaningfully dropped.
The pedestrian deaths investigation I published shows that 76 percent of Arizona's pedestrian fatalities happen in darkness. Wide arterials, missing crosswalks, and insufficient lighting are the design factors. In Phoenix specifically, 59 percent of all fatal crashes happen in the dark.
The Freeway Network
I-10, I-17, Loop 101, Loop 202, SR-51, US-60. Phoenix has more freeway miles per capita than most metro areas. Each corridor has its own crash profile.
I-10 through the West Valley carries 48 percent truck traffic. The truck crash data shows 47 percent of truck crash deaths happen during daytime business hours. The chameleon carriers investigation explains why some carriers on these freeways have safety records that don't reflect their actual history.
The wrong-way crashes investigation shows 1,740 wrong-way driver incidents in Arizona in 2024. Two-thirds involve impaired drivers. The I-17 detection system catches 88 percent of wrong-way entries, but fatal crashes on the corridor haven't dropped.
DUI Crashes: 3,544 in Maricopa County
Maricopa County had 3,544 alcohol-related crashes in 2024. That's 64 percent of the state total. The DUI crash data investigation covers the patterns: late night, weekend, arterial roads. When an impaired driver causes a crash, Arizona's dram shop law may hold the bar liable. The hit-and-run investigation shows impaired drivers are the most likely to flee.
Phoenix Cases by Crash Type
This page is the metro overview. For a car crash specifically, the dedicated page goes deep on the Phoenix corridors, the city's own road-safety records, the applicable Arizona statutes, and what we investigate.
- Car crash lawyer in Phoenix: I-10, I-17, Loop 101, Loop 202, the city's deadliest arterials, ADOT crash data, ARS 12-2505 comparative fault.
We Handle Phoenix Cases
Our offices are in Buckeye and Maricopa. Phoenix is the metro anchor. We file in Maricopa County Superior Court regularly.
The difference is our data. I track the ADOT numbers, the MAG intersection reports, the FMCSA carrier records, and the investigation data that gives every case an evidentiary foundation most firms don't build. That head start matters when the insurance company pushes back.
A Phoenix crash doesn't only hurt you. It hurts the people around you too. Call (602) 654-0202 or use our contact form. We don't charge unless we recover money for you.
Frequently asked questions
How many crashes happen in Phoenix each year?
What are the most dangerous intersections in Phoenix?
How long do I have to file a personal injury claim in Phoenix?
Do you have an office in Phoenix?
What about pedestrian crashes in Phoenix?
What does it cost to hire an injury attorney for a Phoenix crash?
Can I recover compensation if I was partially at fault?
What about DUI crashes in Phoenix?
Attorney advertising. Past results do not guarantee a similar outcome. Every case is different and is decided on its own facts.
You get answers.
Review My CaseFree, no obligation. Available 24/7. No attorney fee unless we win. Case costs may apply.
$3.07M+ recovered · 5.0 stars across 154 Google reviews