
The Finding
I-19 runs about 64 miles from the border at Nogales to I-10 in Tucson. It’s the road that carries Mexican produce north from the Mariposa port, and it carries Green Valley and Sahuarita commuters into Tucson every day.
From 2015 to 2024, 9 fatal crashes involving a large truck happened on I-19. They killed 10 people.
That’s a smaller toll than Arizona’s long interstates. But it isn’t spread evenly, and the people who died were mostly in the cars around the trucks.
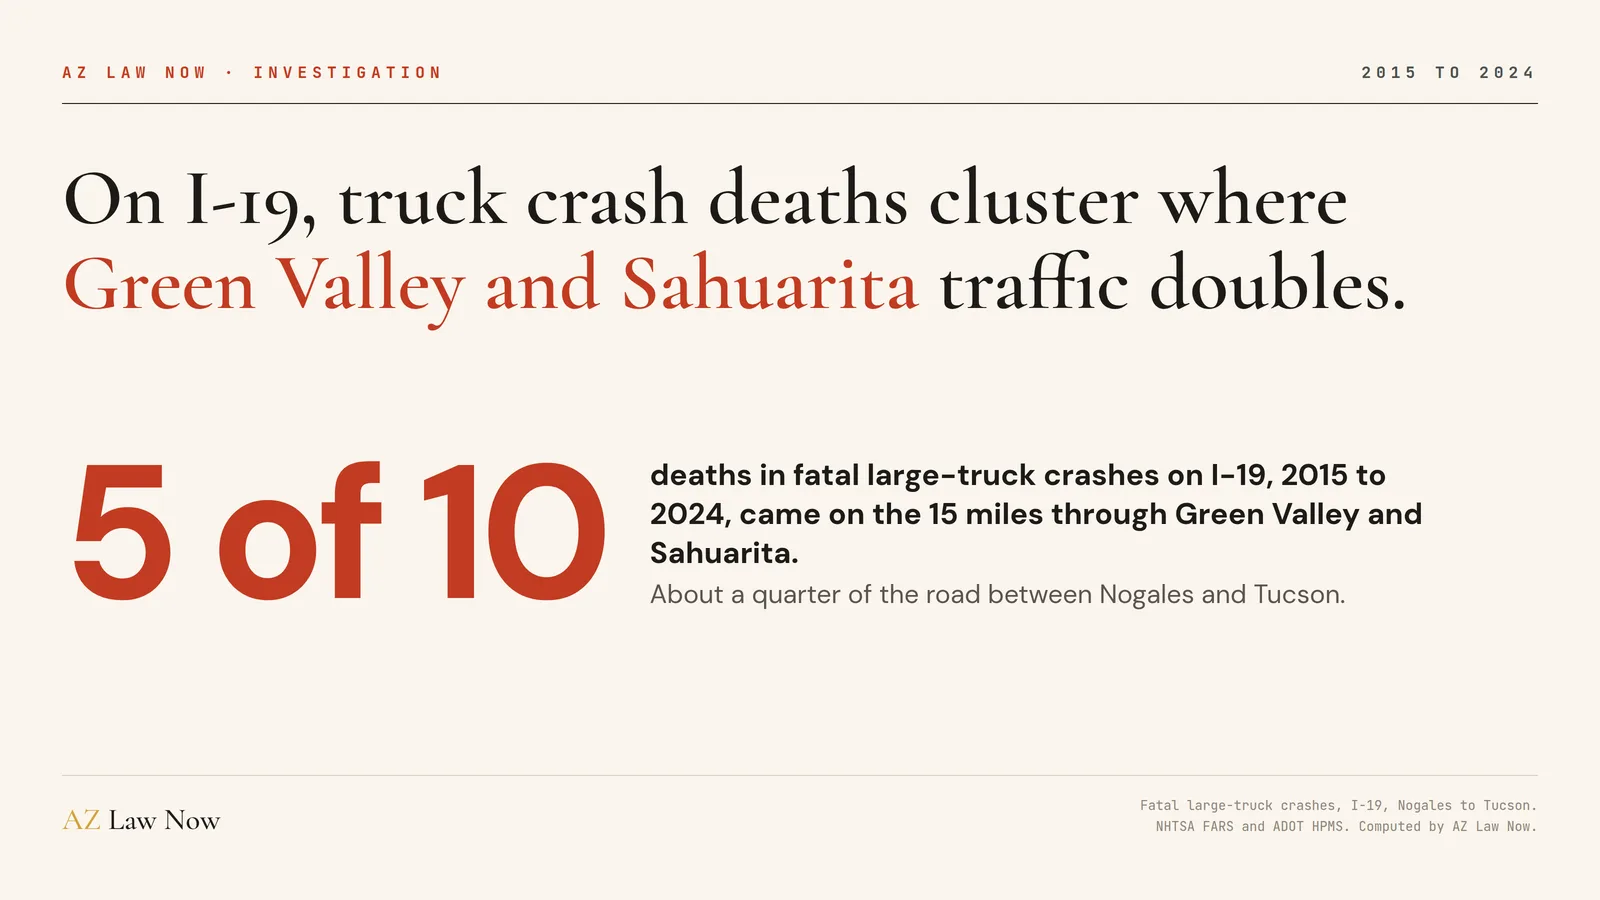
Half the deaths came on the 15 miles from about Continental Road in Green Valley north through Sahuarita. That’s about a quarter of the road.
How I Counted
The fatal crash records come from the National Highway Traffic Safety Administration’s Fatality Analysis Reporting System, the federal census of every fatal crash on a US public road. I kept Arizona crashes from 2015 to 2024 that involved a large truck and that police recorded on I-19.
Each crash went onto the map by its recorded latitude and longitude, using the Arizona Department of Transportation’s own mileposts. Every one landed within a quarter mile of I-19. Crashes on the old Nogales Highway, a separate road, aren’t counted.
Ten deaths is a small number to measure a road by. So I also used the Federal Motor Carrier Safety Administration’s crash file.
That file lists every police-reported truck crash where someone died, someone was hurt, or a vehicle had to be towed. It recorded 216 truck crashes on I-19 over the same ten years, each tagged with the marker where it happened.
To compare stretches fairly, I measured crashes against truck miles traveled. Those come from ADOT’s 2024 counts for the federal highway inventory, held constant for the decade, so treat each rate as an estimate. ADOT’s own crash records also cover injury crashes in more detail. I’ll add them to this piece when they come in.
I-19’s signs are in kilometers. I describe distances here in miles north of the border, so they line up with our other highway investigations.
One Stretch, Two Records Pointing the Same Way
I split I-19 into four stretches. On both the fatal record and the larger crash file, Green Valley and Sahuarita come out on top.
In fatal crashes, that stretch ran about 2.18 deaths per 100 million truck miles. The rest of I-19 ran about 0.73. That’s close to the worst stretch we found on I-17, the miles past Anthem, at 2.25.
In the federal crash file, Green Valley and Sahuarita logged 71 reported truck crashes, about 30.9 per 100 million truck miles. Every other stretch of I-19 ran between 20.5 and 22.3.

The last miles into Tucson log the most truck crashes per mile of road. But they also carry the most trucks, and measured against that traffic they run close to the rest of I-19.
Where the Traffic Doubles
The likeliest explanation is traffic. South of Green Valley, ADOT counts about 21,000 to 30,000 vehicles a day on I-19. Through Green Valley and Sahuarita, the count climbs to between 38,000 and 50,000.
The road doesn’t grow with it. ADOT’s inventory shows two lanes each way for nearly the whole route, through Green Valley and Sahuarita included.
That puts produce trucks and freight in the same two lanes as commuters merging on and off at every Green Valley and Sahuarita exit. Three of the four fatal truck crashes there were rear-end or same-direction sideswipe crashes between a truck and the traffic around it.

Who Died on Those 15 Miles
All 5 people killed in truck crashes through Green Valley and Sahuarita were outside the truck. Every one was driving or riding in a car or SUV.
Two died in rear-end crashes with a truck, both on February mornings. Two more died together in October 2020, when three vehicles collided in a same-direction sideswipe.
In April 2021, a semi had a mechanical failure near Sahuarita, and something it set loose struck a passing SUV. The SUV’s driver was killed.
Trucking companies and their insurers start building their defense within hours. Get someone on your side just as fast.
Call (602) 654-0202, 24/7, or get your free case review. No fee unless we recover.
Worn Equipment Shows Up Twice as Often
That April 2021 crash wasn’t the only one tied to equipment. In the federal crash file, 16 of I-19’s 216 truck crashes involved an equipment failure, such as tires or brakes, or a cargo spill or shift.
That’s about 7.4% of I-19 truck crashes. Statewide, it’s about 3.8%. The difference is a handful of crashes, but it’s nearly double.
The fatal record has two more. In 2018, a straight truck blew a tire between Rio Rico and Tubac and rolled, killing its driver. In 2024, a smaller straight truck ran off the road and rolled near Rio Rico, killing its driver and seriously injuring a passenger.
The Winter Rush
Produce traffic through Nogales peaks during Mexico’s winter growing season. I-19’s truck crashes lean toward the same months.
From November through April, I-19 logged 58% of its reported truck crashes. Statewide, those six months account for about 49%.
What the Border Inspections Show
Federal inspection records show heavy enforcement at the border. In the three years ending September 2026, inspectors logged 5,012 detailed roadside inspections at Nogales and the Mariposa port.
About 1 in 5 trucks inspected there, 20%, was ordered off the road for a vehicle defect until it was fixed. For carriers based in Mexico the rate was 21.5%, against 13.3% for US carriers inspected at the same sites.
Those numbers don’t mean Nogales trucks are worse than the rest of Arizona. The statewide vehicle out-of-service rate over the same years was 26.7%.
The Trucks in the Crashes Are Mostly American
Mexico-based carriers made up 81% of the detailed inspections at Nogales. Around Green Valley and Sahuarita, they made up 3%.
The crash file tells the same story. Of the 216 truck crashes reported on I-19 from 2015 to 2024, 5 involved a carrier based in Mexico. Nearly all the rest were US carriers, and about 3 in 5 crashes involved a carrier based in Arizona.
Most Mexico-based trucks are limited to a commercial zone near the border unless they hold federal long-haul authority. The produce keeps moving north, but the records show it’s mostly on American trucks by the time it reaches Green Valley.
Most of the Dead Weren’t in the Truck
Across all of I-19, 7 of the 10 people killed in fatal truck crashes were in other vehicles. Three were riding in the truck. Another 3 people survived with suspected serious injuries.
Trucks were involved in 9 of the 63 fatal crashes of any kind on I-19 from 2015 to 2024, about 14%. ADOT’s counts put trucks at about 11% of I-19’s traffic.
What This Means
On I-19, the people hurt and killed in truck crashes are mostly in the cars and SUVs around the truck. On the busiest miles through Green Valley and Sahuarita, that means commuters and retirees sharing two lanes with freight headed for Tucson and beyond.
A truck crash on I-19 can involve a carrier from Phoenix, Texas, or Sonora, a broker, a produce shipper, and a repair shop. The police report, the truck’s black-box data, the driver’s logs, and the inspection history each hold part of what happened. Fault isn’t always what the first report suggests.
If a commercial truck hit you or someone you love on I-19, talk to our truck crash lawyers before you talk to the trucking company’s insurer. Our Tucson truck crash attorneys handle cases on I-19 and I-10, and the first conversation is free.
On I-19, half the decade’s truck crash deaths came on the 15 miles where the traffic doubles and the road doesn’t.
Black-box data, maintenance records, and driver logs can be overwritten or thrown out if nobody demands them in time. We send those demands fast, and we know which records matter.
Call (602) 654-0202 now or start your free case review. No fee unless we recover.
Related Coverage
For the legal and process context, see Ron DeBrigida’s guide to Arizona truck crash law and Stephanie Ramirez’s truck crash action plan.
Where I-19 ends at Tucson, see how I-10 truck crash deaths rose 76% between Phoenix and Tucson. For northern Arizona, see where I-17 truck crash deaths cluster past Anthem and Black Canyon City and where I-40 truck crash deaths peak leading into Flagstaff.
On the road to Las Vegas, see why US-93’s deadliest truck miles are two lanes north of Wickenburg. Our Arizona truck death surge investigation covers the whole state.
Frequently asked questions
How many people die in truck crashes on I-19?
What is the most dangerous part of I-19 for truck crashes?
Why does I-19 use kilometers?
Are Mexican trucks causing I-19 crashes?
How often are trucks taken off the road after inspections at Nogales?
How did AZ Law Now count I-19 truck crashes?
What should families do after an I-19 truck crash?
Sources & references
- National Highway Traffic Safety Administration. (2025). Fatality Analysis Reporting System (FARS), 2015 to 2024. Retrieved October 2, 2026, from https://www.nhtsa.gov/research-data/fatality-analysis-reporting-system-fars
- Federal Motor Carrier Safety Administration. Crash File. Retrieved October 2, 2026, from https://data.transportation.gov/d/aayw-vxb3
- Federal Motor Carrier Safety Administration. Vehicle Inspection File. Retrieved October 2, 2026, from https://data.transportation.gov/d/fx4q-ay7w
- Arizona Department of Transportation. (2025). HPMS 2024 data: AADT, truck AADT, lanes, and mileposts for I-19. Retrieved October 2, 2026, from https://services6.arcgis.com/clPWQMwZfdWn4MQZ/ArcGIS/rest/services/HPMS_2024_Data/FeatureServer
- Arizona State Legislature. ARS 12-542: Limitation of Actions, Personal Injury. Retrieved October 2, 2026, from https://www.azleg.gov/ars/12/00542.htm
- Arizona State Legislature. ARS 12-611: Wrongful Death Action. Retrieved October 2, 2026, from https://www.azleg.gov/ars/12/00611.htm
- Arizona State Legislature. ARS 12-821.01: Notice of Claim Against a Public Entity. Retrieved October 2, 2026, from https://www.azleg.gov/ars/12/00821-01.htm