
The Finding
Interstate 10 runs 391 miles across southern Arizona, from the Colorado River at the California line through Quartzsite, Buckeye, Phoenix, Chandler, Casa Grande, Tucson, Benson, and Willcox to New Mexico. It’s the busiest freight corridor in the state.
Over the ten years from 2015 to 2024, 179 fatal crashes involving a large truck happened on the I-10 mainline. They killed 229 people.
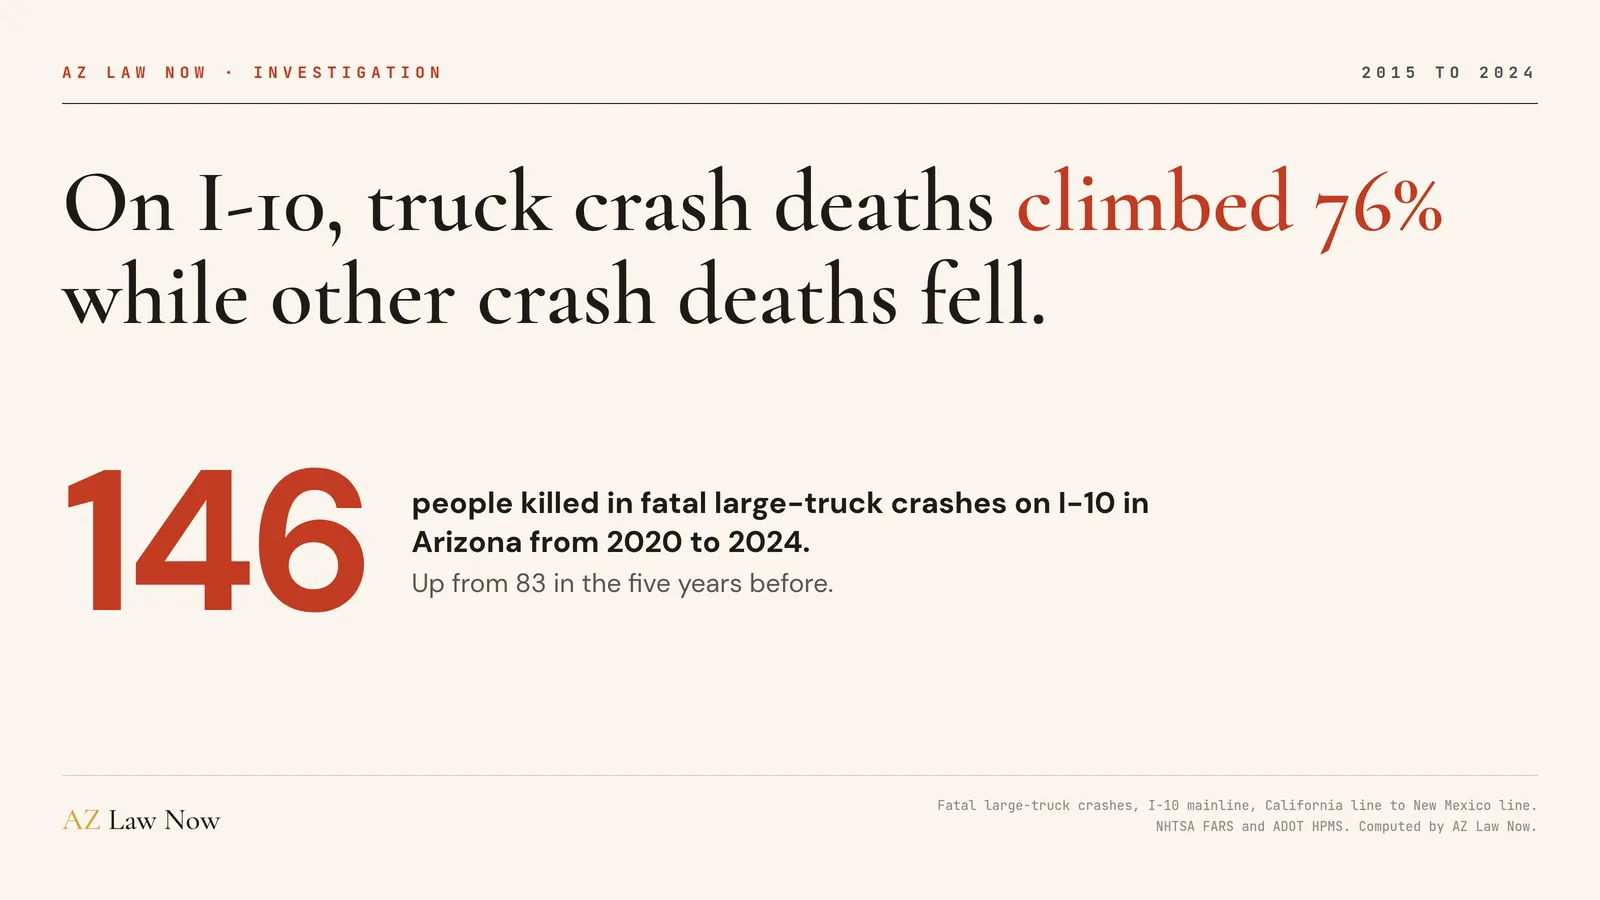
The toll didn’t hold steady. From 2015 to 2019, these crashes killed 83 people. From 2020 to 2024 they killed 146.
2023 was the worst year in the record, with 43 people killed in I-10 truck crashes. 2024 was second, with 35.

Truck Crashes Grew While Other Crashes Didn’t
The rise wasn’t part of a general surge in I-10 deaths. Across all fatal crashes on the I-10 mainline, deaths went from 285 in 2015 to 2019 to 336 in 2020 to 2024.
Take the truck crashes out, and the rest of I-10 went from 202 deaths to 190. Nearly all of the road’s added deaths came from crashes involving a big rig.
Truck crashes accounted for about 3 in 10 I-10 deaths in the first five years. In the last five they accounted for more than 4 in 10.
Statewide, deaths in fatal large-truck crashes rose 66% over the same years. I-10 rose faster.
How I Counted
The crash records come from the National Highway Traffic Safety Administration’s Fatality Analysis Reporting System, the federal census of every fatal crash on a US public road.
My count starts with every Arizona fatal crash from 2015 to 2024 where at least one vehicle was a medium or heavy truck, as FARS codes them. From those, I kept crashes police recorded on the I-10 mainline in either direction, and dropped ramps, exits, and frontage roads.
I placed each crash on the highway by its recorded latitude and longitude, using the Arizona Department of Transportation’s own milepost markers. Four crashes had missing coordinates or coordinates that didn’t fall on I-10, and I placed those by the milepost police recorded.
Some stretches carry far more trucks than others, so I also measured deaths against truck miles traveled. Those truck miles come from ADOT’s 2024 counts for the federal highway inventory, held constant across the decade. Traffic changes year to year, which makes every rate an estimate. The comparison between stretches is what matters.
The federal record covers fatal crashes only, and it says nothing about fault. ADOT’s own crash records also cover crashes where people were hurt but survived. I’ll add them to this piece when they come in.
Where the Deaths Rose
I split I-10 into ten stretches by the cities and towns most drivers know. Three of them account for most of the increase.
On the 93 miles from Quartzsite to Buckeye, deaths went from 19 in the first five years to 37 in the last five.
The 19 miles from downtown Phoenix past Tempe to Chandler went from 2 deaths to 17. And the last 52 miles of I-10 in Arizona, from Willcox to the New Mexico line, went from 4 deaths to 15.

Quartzsite to Buckeye: The Most Deaths on the Road
No stretch of I-10 in Arizona recorded more truck crash deaths than the 93 miles between Quartzsite and Buckeye. Forty fatal truck crashes there killed 56 people and injured 50 more.
ADOT’s inventory shows two lanes in each direction for every one of those miles. Its 2024 counts put trucks at about 48% of all traffic there, the highest share on I-10.
Rear-end crashes dominate the record on this stretch. 22 of the 40 crashes were front-to-rear collisions, and police recorded 19 of the truck drivers involved as driving too fast for conditions.
38 of the 56 people killed there weren’t in the truck.
The trucking company’s insurer usually has people working the crash within hours. You should have someone working for you just as fast.
Call (602) 654-0202, 24/7, or get your free case review. No fee unless we recover.
Benson to Willcox and Through Tucson
Raw counts favor long stretches with heavy traffic. To compare fairly, I measured deaths against truck miles.
By that measure, the 35 miles from Benson to Willcox ran the highest rate on I-10, about 1.89 deaths per 100 million truck miles. The 27 miles through Tucson came next, at about 1.75.
The whole road averaged about 1.25. The lowest rate, about 0.67, was on the 19 miles from the California line to Quartzsite.

Between Benson and Willcox, 12 fatal truck crashes killed 17 people. Half of those crashes were rear-end collisions. This stretch also holds some of the steepest grades on I-10, with about 4.6 of its 35 miles at 2.5% or more.
Through Tucson, from Ina Road to the east side of the city, 23 fatal truck crashes killed 28 people. That’s the densest run of fatal truck crashes on I-10 in Arizona, about 8.5 for every 10 miles.
22 of the 28 people killed in Tucson weren’t in the truck. Four were pedestrians.
Phoenix to Chandler and the Broadway Curve Years
ADOT rebuilt 11 miles of I-10 between the I-17 split near Sky Harbor and Loop 202 in Chandler. Construction on the Broadway Curve project ran from July 2021 to spring 2025.
In the six and a half years before construction began, 3 fatal truck crashes on those 11 miles killed 3 people. From July 2021 through 2024, 7 fatal truck crashes there killed 11 people.
Police coded 5 of those 7 crashes as happening in a construction zone. The worst, a rear-end crash in January 2023, killed 5 people.
The data doesn’t say construction caused these crashes. It does show that the deadliest years on this stretch lined up with the years drivers were squeezed through a work zone.
From Behind, in the Dark, in Work Zones
Rear-end collisions were the most common kind of fatal truck crash on I-10. 71 of the 179 crashes were front-to-rear, and they killed 97 people.
93 of the crashes happened in the dark, and they killed 111 people. Most of I-10 outside Phoenix and Tucson is unlit.
Work zones show up across the whole road, not just in Phoenix. 23 fatal truck crashes on I-10 happened in a work zone, and they killed 37 people. Sixteen of them were rear-end crashes.
Most of these crashes happened on dry, level, straight road in clear weather. Police recorded 45 of the 240 truck drivers involved as speeding or driving too fast for conditions.
Most of the Dead Weren’t in the Truck
Of the 229 people killed, 168 were outside the truck. Most were driving or riding in cars, pickups, and SUVs, and 28 were on foot. Sixty-one were riding in a large truck.
24 of the 28 fatal crashes that killed a pedestrian happened in the dark.
These crashes also left survivors. Another 217 people were hurt, 68 of them recorded with suspected serious injuries.
About 1 in 3 Trucks Inspected Along I-10 Failed
Federal inspection records show what’s rolling down I-10. Inspectors logged 32,621 detailed roadside inspections at I-10 towns, ports of entry, and mileposts between October 2023 and September 2026.
They ordered 33.5% of the trucks inspected there out of service, against 23.8% everywhere else in Arizona. An out-of-service order means a defect serious enough that the truck can’t move until it’s fixed, such as failing brakes or tires.
The two ports of entry stand out. At the California line port, inspectors put about 48% of inspected trucks out of service. At the New Mexico line port, about 65%.
Drivers fared worse too. About 16% of drivers inspected along I-10 were ordered out of service, for problems such as hours-of-service and licensing violations, against about 13% elsewhere in Arizona.
Most of the trucks in these fatal crashes came from out of state. California registrations led with 77 of the 240 trucks. Our earlier I-10 out-of-state truck investigation breaks that down by state.
What This Means
On I-10, the people paying for truck crashes are mostly the families in the cars around the truck, and there are more of them every year.
No single record explains one of these crashes. The answer is usually split across the police report, the driver’s logs, the truck’s black-box data, its federal inspection history, and the carrier’s safety file.
If a commercial truck hit you or someone you love on I-10, talk to our truck crash lawyers before you talk to the trucking company’s insurer. We handle truck cases from Phoenix to Tucson, and the first conversation is free.
Driver logs and black-box data can be overwritten or thrown out if nobody demands them in time. We send those demands fast, and we know which records matter.
Call (602) 654-0202 now or start your free case review. No fee unless we recover.
Related Coverage
For the legal and process context, see Ron DeBrigida’s guide to Arizona truck crash law and Stephanie Ramirez’s truck crash action plan.
For every kind of fatal crash on this road over 25 years, see Arizona’s I-10 deadliest stretches. For the downtown Phoenix stretch, see our look at the I-10 Deck Park Tunnel crash corridor.
For Arizona’s other truck corridors, see where I-17 truck crash deaths cluster past Anthem and Black Canyon City and where I-40 truck crash deaths peak leading into Flagstaff. For the statewide picture, see the Arizona truck death surge.
For the road from Wickenburg to Kingman and Hoover Dam, see why US-93’s deadliest truck miles are two lanes north of Wickenburg.
Frequently asked questions
How many people die in truck crashes on I-10 in Arizona?
Are truck crash deaths on I-10 going up?
Where on I-10 are fatal truck crashes most common?
What kind of truck crashes kill people on I-10?
Who dies in I-10 truck crashes?
How did AZ Law Now count I-10 truck crashes?
What should families do after an I-10 truck crash?
Sources & references
- National Highway Traffic Safety Administration. (2025). Fatality Analysis Reporting System (FARS), 2015 to 2024. Retrieved October 2, 2026, from https://www.nhtsa.gov/research-data/fatality-analysis-reporting-system-fars
- Arizona Department of Transportation. (2025). HPMS 2024 data: AADT, truck AADT, through lanes, grade, and mileposts for Interstate 10. Retrieved October 2, 2026, from https://services6.arcgis.com/clPWQMwZfdWn4MQZ/ArcGIS/rest/services/HPMS_2024_Data/FeatureServer
- Arizona Department of Transportation. I-10 Broadway Curve Project. Retrieved October 2, 2026, from https://azdot.gov/i-10-broadway-curve-project
- Federal Motor Carrier Safety Administration. Vehicle Inspection File. Retrieved October 2, 2026, from https://data.transportation.gov/d/fx4q-ay7w
- Arizona State Legislature. ARS 12-542: Limitation of Actions, Personal Injury. Retrieved October 2, 2026, from https://www.azleg.gov/ars/12/00542.htm
- Arizona State Legislature. ARS 12-611: Wrongful Death Action. Retrieved October 2, 2026, from https://www.azleg.gov/ars/12/00611.htm
- Arizona State Legislature. ARS 12-821.01: Notice of Claim Against a Public Entity. Retrieved October 2, 2026, from https://www.azleg.gov/ars/12/00821-01.htm