
Every crash report in Arizona goes into the same database. A sedan rear-ending another sedan at a red light. A motorcycle going down on loose gravel. A fully loaded tractor-trailer crossing the median on I-10 at 65 miles per hour and killing everyone in the oncoming car.
ADOT publishes the totals in its annual Crash Facts report. It’s a thorough document. But it treats commercial vehicles as a line item, a few tables in Section 5: truck and bus involvements, fatalities, injuries. No corridor breakdown. No time-of-day analysis. No separation of the West Valley freight corridor from the Loop 101 commuter traffic.
What the public record does show, when you read the state and federal data side by side, is a clear picture of how often trucks crash in Arizona, how deadly those crashes are, and where the danger concentrates. Here’s what the numbers say, and where they stop.
14,069 Trucks in Arizona Crashes Last Year
ADOT’s 2024 Crash Facts report counts 236,193 total vehicle involvements in Arizona crashes. Of those, 14,069 were trucks and buses. That’s 5.96% of all vehicles involved.
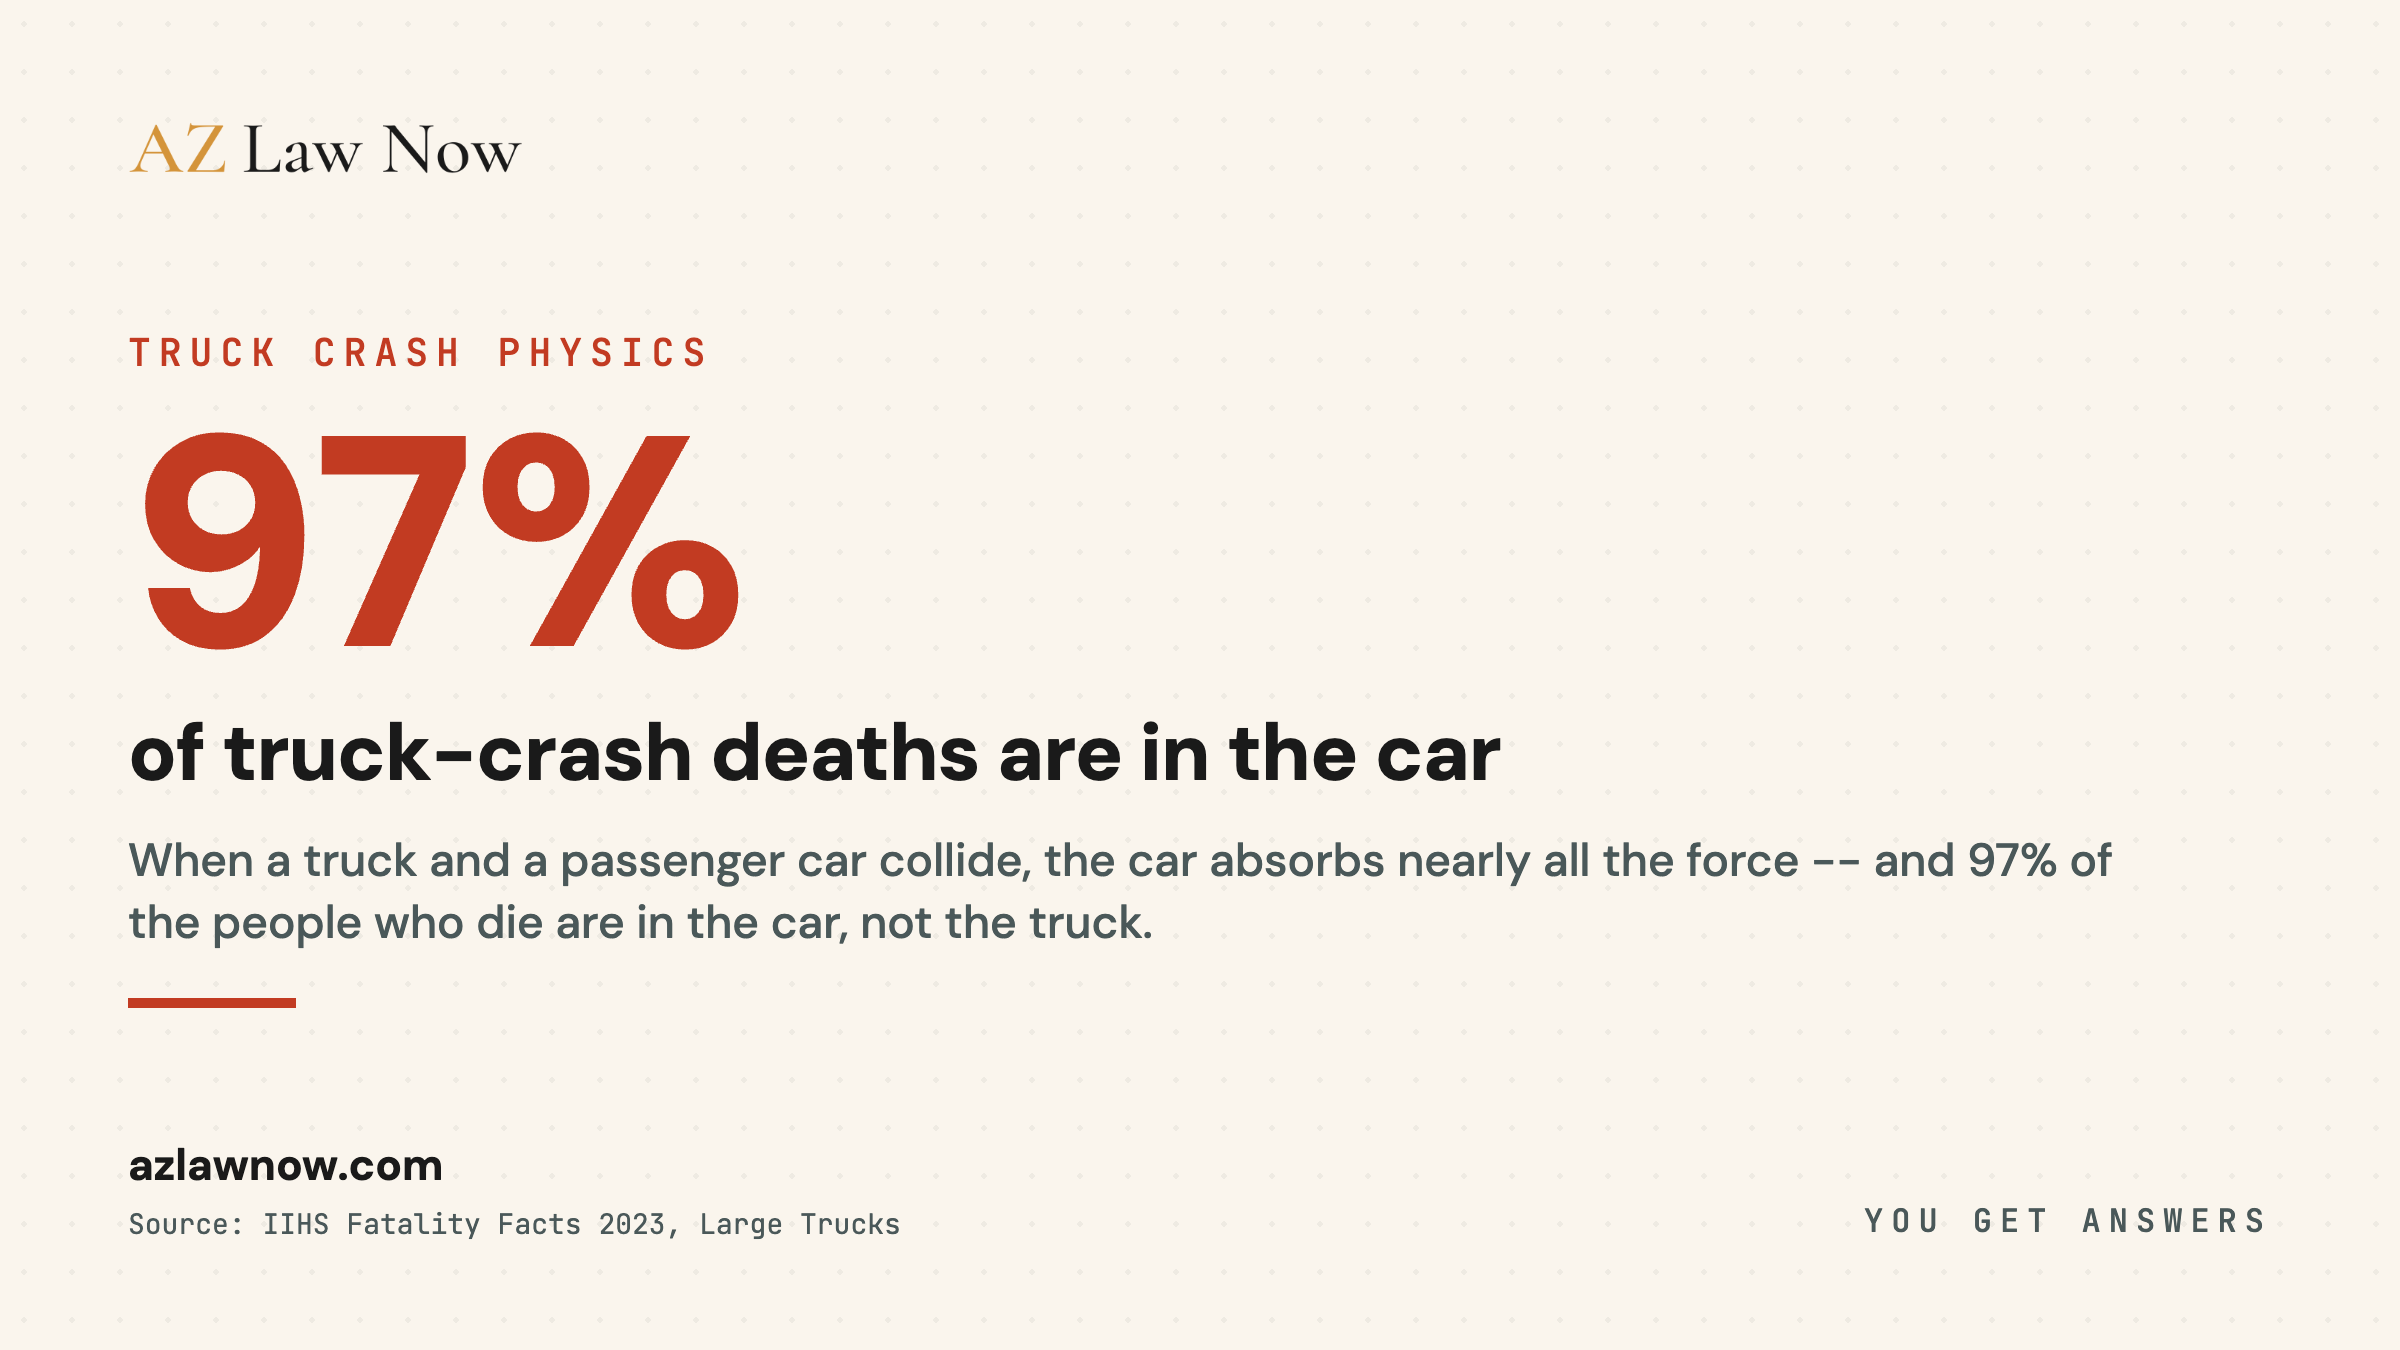
But that 6% share disappears when you look at severity.
Of those 14,069 truck involvements, 153 were in fatal crashes. And when a truck is in a fatal crash, the people who die are overwhelmingly in the other vehicle.
The Insurance Institute for Highway Safety breaks down the math nationally. In two-vehicle crashes between a passenger car and a large truck in 2023, 97% of the people killed were in the passenger vehicle. Three percent were in the truck.
That ratio isn’t an accident. It’s physics. A fully loaded tractor-trailer can run to the federal limit of 80,000 pounds against a midsize sedan’s few thousand. At highway speeds, the energy transfer is catastrophic and almost entirely one-directional. The truck keeps moving. The car crumples.
When a truck and a passenger car collide at speed, the car absorbs almost all of the force. That is the mechanism behind the IIHS finding that 97% of the people killed in two-vehicle truck-and-car crashes are in the car. The disparity is why a crash that a truck driver may walk away from can kill everyone in the vehicle it hits.
Maricopa County: 682 Fatalities and Climbing
Maricopa County recorded 682 traffic fatalities in 2024. That’s up from 594 in 2023. A 14.8% increase in one year.
The county accounts for 55.5% of all traffic deaths in Arizona, 682 of the statewide total of 1,228. More people. More vehicles. More miles driven. More deaths, and the count moved the wrong way in a single year.
The national scale is its own warning. NHTSA’s 2023 final data counts 5,472 people killed in crashes involving large trucks across the country, a figure that uses NHTSA’s broad definition of any truck over 10,000 pounds. The IIHS, which uses a narrower scope focused on tractor-trailers, counts 4,354 large-truck deaths for the same year. Either way, large trucks account for roughly one in nine to one in eight of all U.S. traffic deaths. Being near a national rate isn’t comfort. It’s a body count.
Where the Trucks Are
Not all corridors carry the same freight load. And here is the data gap that matters most: no public ADOT report breaks down truck involvements, or truck-traffic share, corridor by corridor. Crash Facts reports a statewide line item. It doesn’t tell a West Valley commuter how the freight load on I-10 west of Goodyear compares to the commuter mix on Loop 101.
That breakdown exists in the underlying data. The Arizona Crash Information System holds geocoded, corridor-level crash records, and ADOT’s traffic-monitoring program counts vehicles by class on the interstates. Neither is published in a form a parent or a driver can read. To build the corridor-level picture, the share of I-10 traffic that is commercial, the count of truck crashes between Ehrenberg and central Phoenix, you have to request the records and assemble them. We’ve filed for the ACIS corridor data covering 2022 through 2024. Until it’s in hand, this report stays with what the public record proves.
What the public record does establish is direction. I-10 through the West Valley is the spine of the state’s freight network, the route that moves containers off the Southern California ports toward the rest of the country. It runs straight past the warehouse cluster in Buckeye and Goodyear. More freight infrastructure on that corridor means more trucks sharing it with the commuters who live there.
Why the West Valley Keeps Adding Trucks
Phoenix added 58.9 million square feet of distribution and warehouse space between 2019 and 2023. The metro ranks fourth nationally in warehouse percentage growth and fifth in total square footage. Total industrial inventory across the Valley is now 460 million square feet.
Most of that growth is in the West Valley. Along I-10.
Walmart bought a 1.27-million-square-foot warehouse near I-10 and Loop 101 in Glendale for $152 million. Amazon leased over a million square feet at West 202 Logistics off I-10 and operates roughly three dozen facilities across the Valley. The company employs around 36,000 people in Arizona, making it one of the state’s largest private employers.
Union Pacific doubled the capacity of its Casa Grande rail yard south of Phoenix, feeding more intermodal freight onto I-10.
Industrial rents in Phoenix average $14.90 per square foot. Los Angeles averages $18.40. That differential, plus Arizona’s proximity to the ports of Long Beach and LA, plus TSMC’s $65 billion semiconductor investment creating supplier logistics demand, means the warehouse pipeline isn’t slowing down.
More warehouses mean more trucks. More trucks mean more miles on I-10 through Buckeye and Goodyear. The math only goes one direction.
When Trucks Crash
The national data from IIHS and NHTSA reveals a pattern that’s different from regular traffic crashes.
Forty-seven percent of large truck crash deaths happen between 6 a.m. and 3 p.m. That’s business hours. Trucks are moving during the day, and that’s when the fatal collisions cluster. For non-truck crashes, only 28% of deaths fall in that same window.
Thursday is the deadliest day for truck crashes. Eighty-two percent of truck crash deaths happen Monday through Friday. Weekends account for just 18%, compared to 36% for non-truck crashes.
The implications for I-10 commuters in the West Valley are straightforward. If you’re driving to work on a Tuesday morning at 8 a.m., you’re in the peak window for truck crash risk. It’s not the late-night hours that are most dangerous when trucks are involved. It’s the workday.
ADOT’s statewide data shows Friday as the peak crash day overall with 20,132 crashes in 2024. Sunday is the lowest at 11,980. But within those totals, the commercial vehicle share is concentrated on weekdays during commercial hours.
What Inspectors Find When They Look
The Commercial Vehicle Safety Alliance runs an annual International Roadcheck, a three-day enforcement blitz across North America. The 2024 edition inspected 48,761 trucks.
The vehicle out-of-service rate was 23%. Nearly one in four trucks inspected was too dangerous to keep operating.
The driver out-of-service rate was 4.8%. Roughly one in twenty drivers was pulled off the road for violations.
A 23% vehicle OOS rate means that on any given day, roughly one in four commercial trucks on the road would be pulled off if inspected. These aren’t paperwork violations. Defective brakes and bad tires are mechanical failures that directly cause crashes. The inspection only catches what’s running past a checkpoint. Most trucks never see a checkpoint.
In Arizona, DPS ran Operation Full House at the Ehrenberg port of entry on I-10 in March 2026. Two days, 254 inspections. They found 925 violations. Fifty-one drivers placed out of service. Eighty-two vehicles placed out of service. That’s a 20% driver OOS rate and 32% vehicle OOS rate. Worse than the national average on both counts.
Those were the trucks they caught at a checkpoint that’s open four days a week.
Arizona vs. Every Other Sun Belt State
Federal FARS data for Arizona and every comparable Sun Belt state shows Arizona’s fatality rate per 100 million vehicle miles traveled is the worst of the group.
Arizona’s per-capita rate is 17.5 deaths per 100,000 residents. Only New Mexico (20.7) and South Carolina (19.5) are worse. The national average is lower by a significant margin.
For large truck fatalities specifically, Arizona recorded 155 in 2023 per NHTSA FARS final data. Texas leads nationally at 730, which is expected given its size and freight volume. But on a per-capita or per-VMT basis, Arizona consistently lands in the top tier for danger.
The state’s combination of high speeds, long rural corridors, extreme heat that degrades tires and brakes, and a logistics boom that’s adding trucks faster than infrastructure or enforcement can keep up creates conditions that other Sun Belt states don’t share at the same intensity.
The I-10 Chandler Crash Changed the Conversation
On January 12, 2023, Danny Glen Tiner was driving a commercial garbage truck on I-10 near Chandler Boulevard. He was doing 68 mph in a 55-mph construction zone. FBI phone forensics confirmed he was scrolling TikTok.
He never touched the brakes.
His truck plowed into two passenger vehicles stopped in congestion, wedging them into a second semi ahead. The vehicles caught fire. Five people died. Ryan Gooding, Andrew Standifird, Jerardo Vazquez, Willis Thompson, and Gilberto Franco.
Tiner was sentenced to 22.5 years in prison. It was the first conviction in Arizona DPS history for a fatal crash caused by social media distraction while driving.
His employer, Mr. Bult’s Inc., had 26 crashes on file with DOT.
That case put a name and a sentence on something most people already sense when they drive I-10. The trucks aren’t an abstraction. They’re 80,000 pounds of steel and cargo in the next lane, controlled by a human who may or may not be watching the road.
What You Can Do If a Truck Hits You
Truck crash cases move on a different timeline and a different scale than car-on-car crashes.
The trucking company’s rapid-response team will be at the scene or on the phone with their insurer within hours. They’re preserving evidence for their defense before you’ve been discharged from the ER.
The electronic logging device data, the truck’s event data recorder, the carrier’s maintenance logs, and dispatch communications all have retention windows. If nobody sends a preservation letter, that data can be overwritten or destroyed.
Arizona is a pure comparative negligence state under ARS 12-2505. You can recover compensation even if you were partially at fault. But the trucking company’s lawyers will try to shift as much fault onto you as possible to reduce what they owe.
There’s no cap on non-economic or punitive damages in Arizona. That’s different from Texas and some other states. If the trucking company’s negligence was egregious, a jury can award punitive damages without a statutory ceiling.
The two-year statute of limitations under A.R.S. 12-542 starts on the date of the crash, and two years from the date of death for wrongful death under A.R.S. 12-611. But evidence in trucking cases starts degrading in days, not years. ELD data, black box recordings, driver logs, and maintenance records all have limited retention.
The sooner an attorney sends a spoliation letter, the more evidence survives. Cases involving federal regulations and multiple defendants typically land in Maricopa County Superior Court when damages exceed $10,000, and nearly every serious truck crash case clears that threshold within the first week of treatment.
AZ Law Now handles truck crash cases across Maricopa County. An initial review pulls FMCSA carrier records, ADOT crash data, and ELD logs on every trucking case. Drivers and families can reach the firm at (602) 654-0202 or through the contact form. Intake is confidential. Representation is on contingency.
What I’m Tracking Next
ADOT’s public Crash Facts report doesn’t separate commercial vehicle crashes by corridor. The data exists in the Arizona Crash Information System, but it requires a registered account and manual queries. I’m pulling I-10-specific commercial vehicle crash data through ACIS for 2022 through 2024 to build a corridor-level picture that doesn’t exist in any public report.
I also filed a records request with DPS for roadside inspection data on I-10 between Ehrenberg and Phoenix. I want to see how many carriers flagged on I-10 have prior out-of-service orders, and how many are operating under DOT numbers that were issued after a previous carrier was shut down.
The warehouse boom isn’t slowing. The truck counts aren’t dropping. ADOT’s widening projects help, but they don’t change the ratio of trucks to cars on a corridor where nearly half the traffic is commercial.
I’ll update this piece when the ACIS data comes back.
Related Coverage
For the legal and process context, see Ron DeBrigida’s guide to Arizona truck crash law, Stephanie Ramirez’s truck crash action plan, the truck crashes practice overview.
Frequently asked questions
How many truck crashes happen in Arizona each year?
Why are truck crashes so much more deadly than car crashes?
Which Arizona highways have the most truck traffic?
What percentage of trucks fail roadside inspections?
When are truck crashes most likely to happen?
What should I do after being hit by a truck in Arizona?
What is the average settlement amount for a car accident in Arizona?
How much are most truck accident settlements?
How much of a 30K settlement will I get?
How long does a truck accident settlement take?
Sources & references
- Arizona Department of Transportation. (2025). 2024 Arizona Motor Vehicle Crash Facts. Retrieved June 8, 2026, from https://azdot.gov/sites/default/files/2025-07/2024-Crash-Facts.pdf
- National Highway Traffic Safety Administration. (2025). 2023 FARS Final Data: Large Trucks (DOT HS 813 717). Retrieved June 8, 2026, from https://crashstats.nhtsa.dot.gov/Api/Public/ViewPublication/813717.pdf
- Insurance Institute for Highway Safety. (2025). Fatality Facts 2023: Large Trucks. Retrieved June 8, 2026, from https://www.iihs.org/topics/fatality-statistics/detail/large-trucks
- Insurance Institute for Highway Safety. (2025). Fatality Facts 2023: State by State. Retrieved June 8, 2026, from https://www.iihs.org/topics/fatality-statistics/detail/state-by-state
- Arizona Department of Public Safety. (2026). Danny Glen Tiner Sentenced to 22.5 Years. Retrieved June 8, 2026, from https://www.azdps.gov/news/releases/1053
- CDL Life. (2026). Over 900 Violations Uncovered During Two-Day Commercial Vehicle Enforcement Detail in Arizona. Retrieved June 8, 2026, from https://cdllife.com/2026/over-900-violations-uncovered-during-two-day-commercial-vehicle-enforcement-detail-in-arizona/
- FreightWaves. (2025). Walmart's $152M Deal Signals Arizona's Logistics Real Estate Boom. Retrieved June 8, 2026, from https://www.freightwaves.com/news/walmarts-152m-deal-signals-arizonas-logistics-real-estate-boom
- Arizona Crash Information System (ACIS). Corridor-level commercial vehicle crash records (public-records request, pending) https://azdot.gov/mvd/services/professional-services/crash-data