The City of Buckeye had two designs in front of it for the intersection of Durango Street and Yuma Road. One was a modern roundabout. One was a signalized intersection.
The City chose the signalized design.
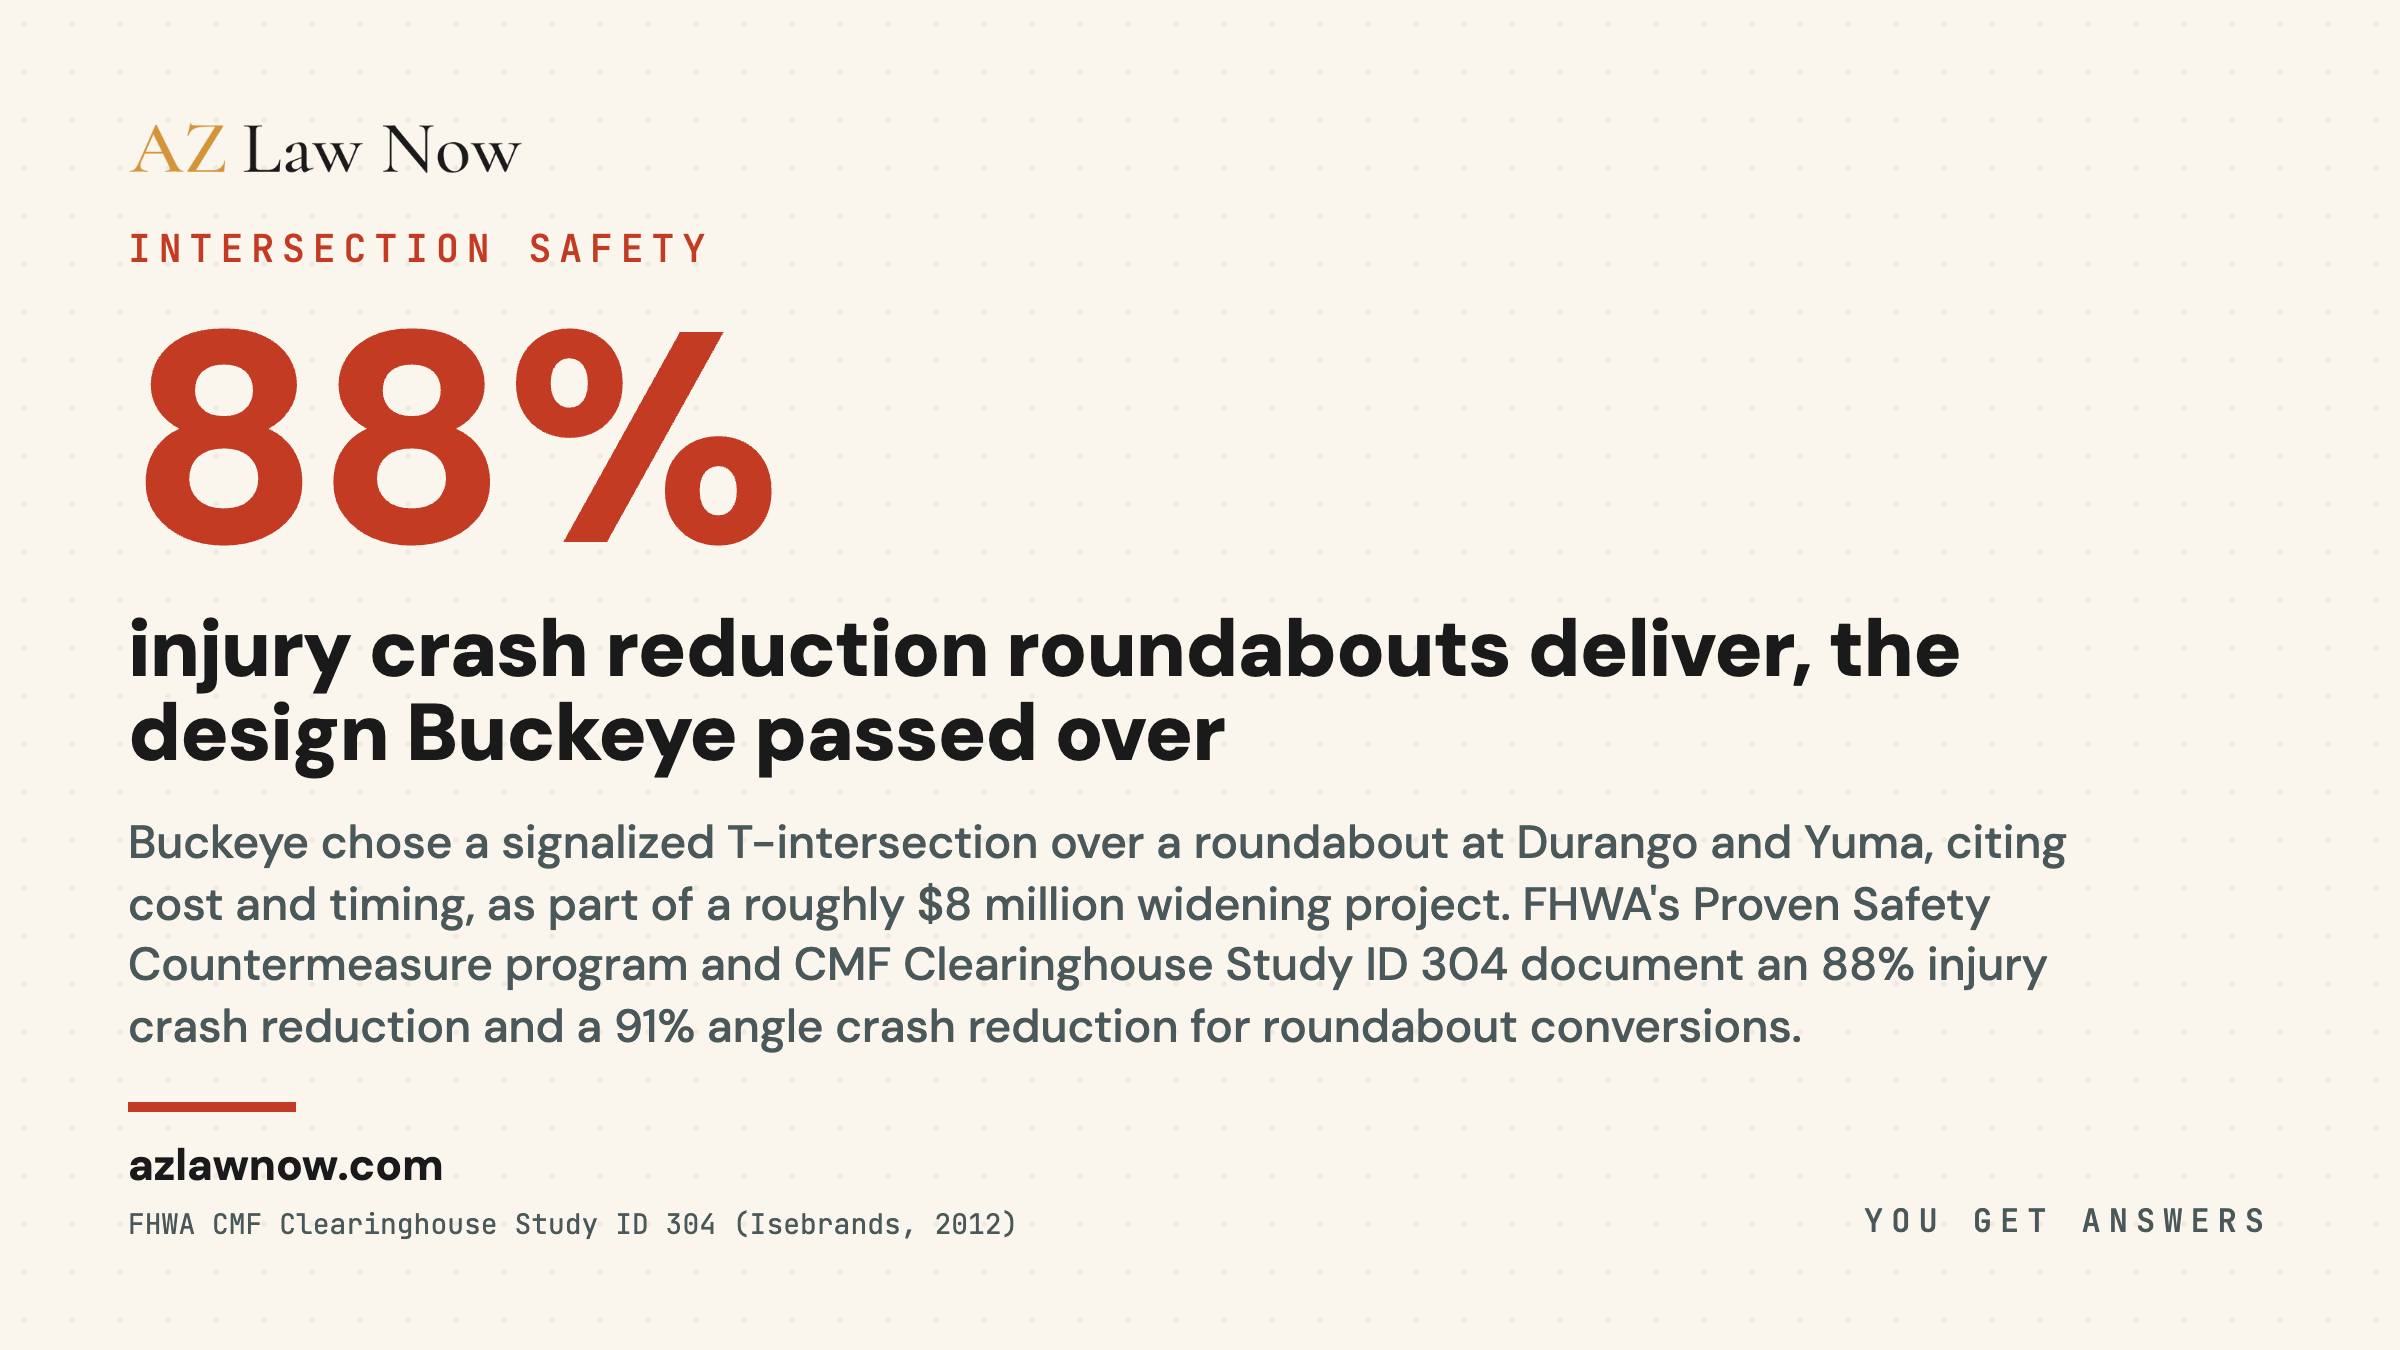
Local reporting on the decision (Your Valley’s “No roundabout for major Buckeye intersection” and InBuckeye) describes the City favoring the signalized intersection on cost, construction timing, and the city’s rapid growth, as part of a roughly $8 million Durango Street widening project running through FY2025/2026.
What the City Weighed
Local coverage of the decision describes the City weighing the roundabout against the signalized design and favoring the signalized option on cost, construction timing, and the city’s rapid growth.
We have asked for the underlying engineering report and have not been able to obtain a public copy. Until we can verify it, we don’t publish the specific cost, right-of-way, parcel, or utility figures that have circulated for this project. We publish primary-source documents in full where we can confirm them.
What the public record does support is the shape of the tradeoff. Cost and timing won. The safety case, which national data ties to roundabouts, did not carry the decision.
How the National Data Compares
The federal safety data favors the design the City passed over.
FHWA lists roundabouts as a Proven Safety Countermeasure and documents large reductions in fatal and injury crashes when intersections convert to roundabouts. The strongest case is rural high-speed conversions: CMF Clearinghouse Study ID 304 (Isebrands, 2012) reports roughly an 88% injury crash reduction and a 91% angle crash reduction.
Durango at Yuma is an arterial intersection in a fast-growing suburban city. The national data is consistent on direction: roundabouts cut the high-severity crashes (the right-angle T-bones and high-speed rear-ends that put people in trauma centers) more than a signalized design does.
This is FHWA’s Proven Safety Countermeasures program telling state and local engineers, in writing, that roundabouts are how you prevent the crashes that send people to trauma centers.
The Population Trajectory
The Census Bureau counted 91,502 Buckeye residents in 2020. Its 2024 estimate puts the city at about 114,334. That’s roughly 25% growth in four years. Buckeye sits consistently in the top tier of the fastest-growing US cities.
The math gets worse from here.
Annual Average Daily Traffic on suburban arterials scales with population. Double-digit population growth over four years implies meaningful AADT growth at every arterial intersection in the city, including Durango and Yuma. Crash rate is a function of exposure, and the exposure is climbing.
Across a 20-year pavement design life, the gap between a roundabout’s crash performance and a signalized design’s, at an arterial intersection in one of the fastest-growing cities in the United States, adds up to a measurable, real number of additional injuries.
What This Means If You’re Hurt There
If you’re injured in a crash at the new Durango and Yuma intersection after construction completes, several things matter quickly:
- Document the geometry. Phone photos of the lane configuration, signal phasing, sight lines, and vehicle final-rest positions are all evidence. Intersection design contributes to crashes more often than insurance adjusters acknowledge.
- Don’t give a recorded statement. Insurance representatives for the at-fault driver will call within hours. Anything you say without counsel can narrow your case.
- Watch the public-entity clock. A municipal corporation like Buckeye is a public entity. Arizona requires a Notice of Claim within 180 days under ARS 12-821.01 for any claim against a public entity. That includes claims that involve intersection design or maintenance. Miss the deadline, lose the right.
- Call a lawyer early. Traffic-camera retention windows are short. ELD data on commercial vehicles ages out. Witness recall fades.
If you’ve already been hurt at this intersection in its current configuration, the same advice applies. The decision the City made on the redesign doesn’t change the law on what you’re owed for what already happened.
The Bigger Point
The FHWA backing for roundabouts as a serious-injury countermeasure is unambiguous. The City weighed that safety case against cost, construction timing, and the public’s unfamiliarity with the design, and chose the signalized intersection.
Every state in the country has cities that are now built around roundabouts. Carmel, Indiana, has more than 150. They were unfamiliar there too, once.
The intersection at Durango and Yuma will see traffic for decades. The decisions about how it gets built are being made right now, in public records, by people whose names are on the documents.
It deserves to be read.
This investigation is built from local reporting on the City of Buckeye’s intersection decision, FHWA national safety data, and US Census population figures. If you have public records, public-comment transcripts, council vote tallies, the engineering report, or correspondence on the Durango and Yuma intersection decision, contact us. We publish primary-source documents in full where the facts warrant it.
Related Coverage
For the legal and process context, see Ron DeBrigida’s guide to Arizona car crash law, Stephanie Ramirez’s car crash first 48 hours, the car crashes practice overview.
Frequently asked questions
What did Buckeye decide at the Durango and Yuma intersection?
Why did Buckeye choose the signalized design over a roundabout?
How do roundabouts compare to signalized intersections in national safety data?
How fast is Buckeye growing, and what does that mean for traffic at this intersection?
What should I do if I'm hurt in a crash at Durango and Yuma after the redesign?
Who in Buckeye made the decision to reject the roundabout?
Is it worth getting an attorney for a car accident in Arizona?
What is the average settlement for a car accident in Arizona?
What is the hardest injury to prove?
What not to tell your insurance company?
Sources & references
- Independent Newsmedia. (2025). No roundabout for major Buckeye intersection. Your Valley (yourvalley.net).
- Federal Highway Administration. (2024). Roundabouts: Proven Safety Countermeasure. Retrieved April 22, 2026, from https://highways.dot.gov/media/33861
- FHWA Crash Modification Factors Clearinghouse. (2012). Study ID 304: Isebrands, H. (2012). Crash modification factors for converting rural high-speed intersections to roundabouts. Retrieved from https://cmfclearinghouse.fhwa.dot.gov/study_detail.php?stid=304
- US Census Bureau. (2024). QuickFacts: Buckeye city, Arizona. Retrieved April 22, 2026, from https://www.census.gov/quickfacts/fact/table/buckeyecityarizona/PST045224
- Arizona State Legislature. (2025). ARS 12-821.01: Authorization of Claim Against Public Entity, Public School or Public Employee. Retrieved from https://www.azleg.gov/ars/12/00821-01.htm
- City of Buckeye. (2025). Durango Street Widening Project Public Meeting. Retrieved from https://inbuckeye.com/development/public-meeting-on-durango-street-widening-project/