
I pulled the federal fatality file for one highway and counted every death on it for 25 years. The number came back at 2,042 people killed on Arizona’s stretch of I-10, from 2000 through 2024, across 1,674 separate fatal crashes.
That’s 7.9% of every traffic death in the state, nearly 1 in 12, concentrated on a single interstate. No other road in Arizona carries a share like it.
The pattern under that number is what makes it a story, not just a tally. The deaths aren’t spread evenly across the years, and they aren’t caused by the crash type most drivers fear.
So I broke the record apart: by year, by county, by how the crash unfolded, and by where on the road it happened.
The Toll Fell for a Decade. Now It’s Climbing Again.
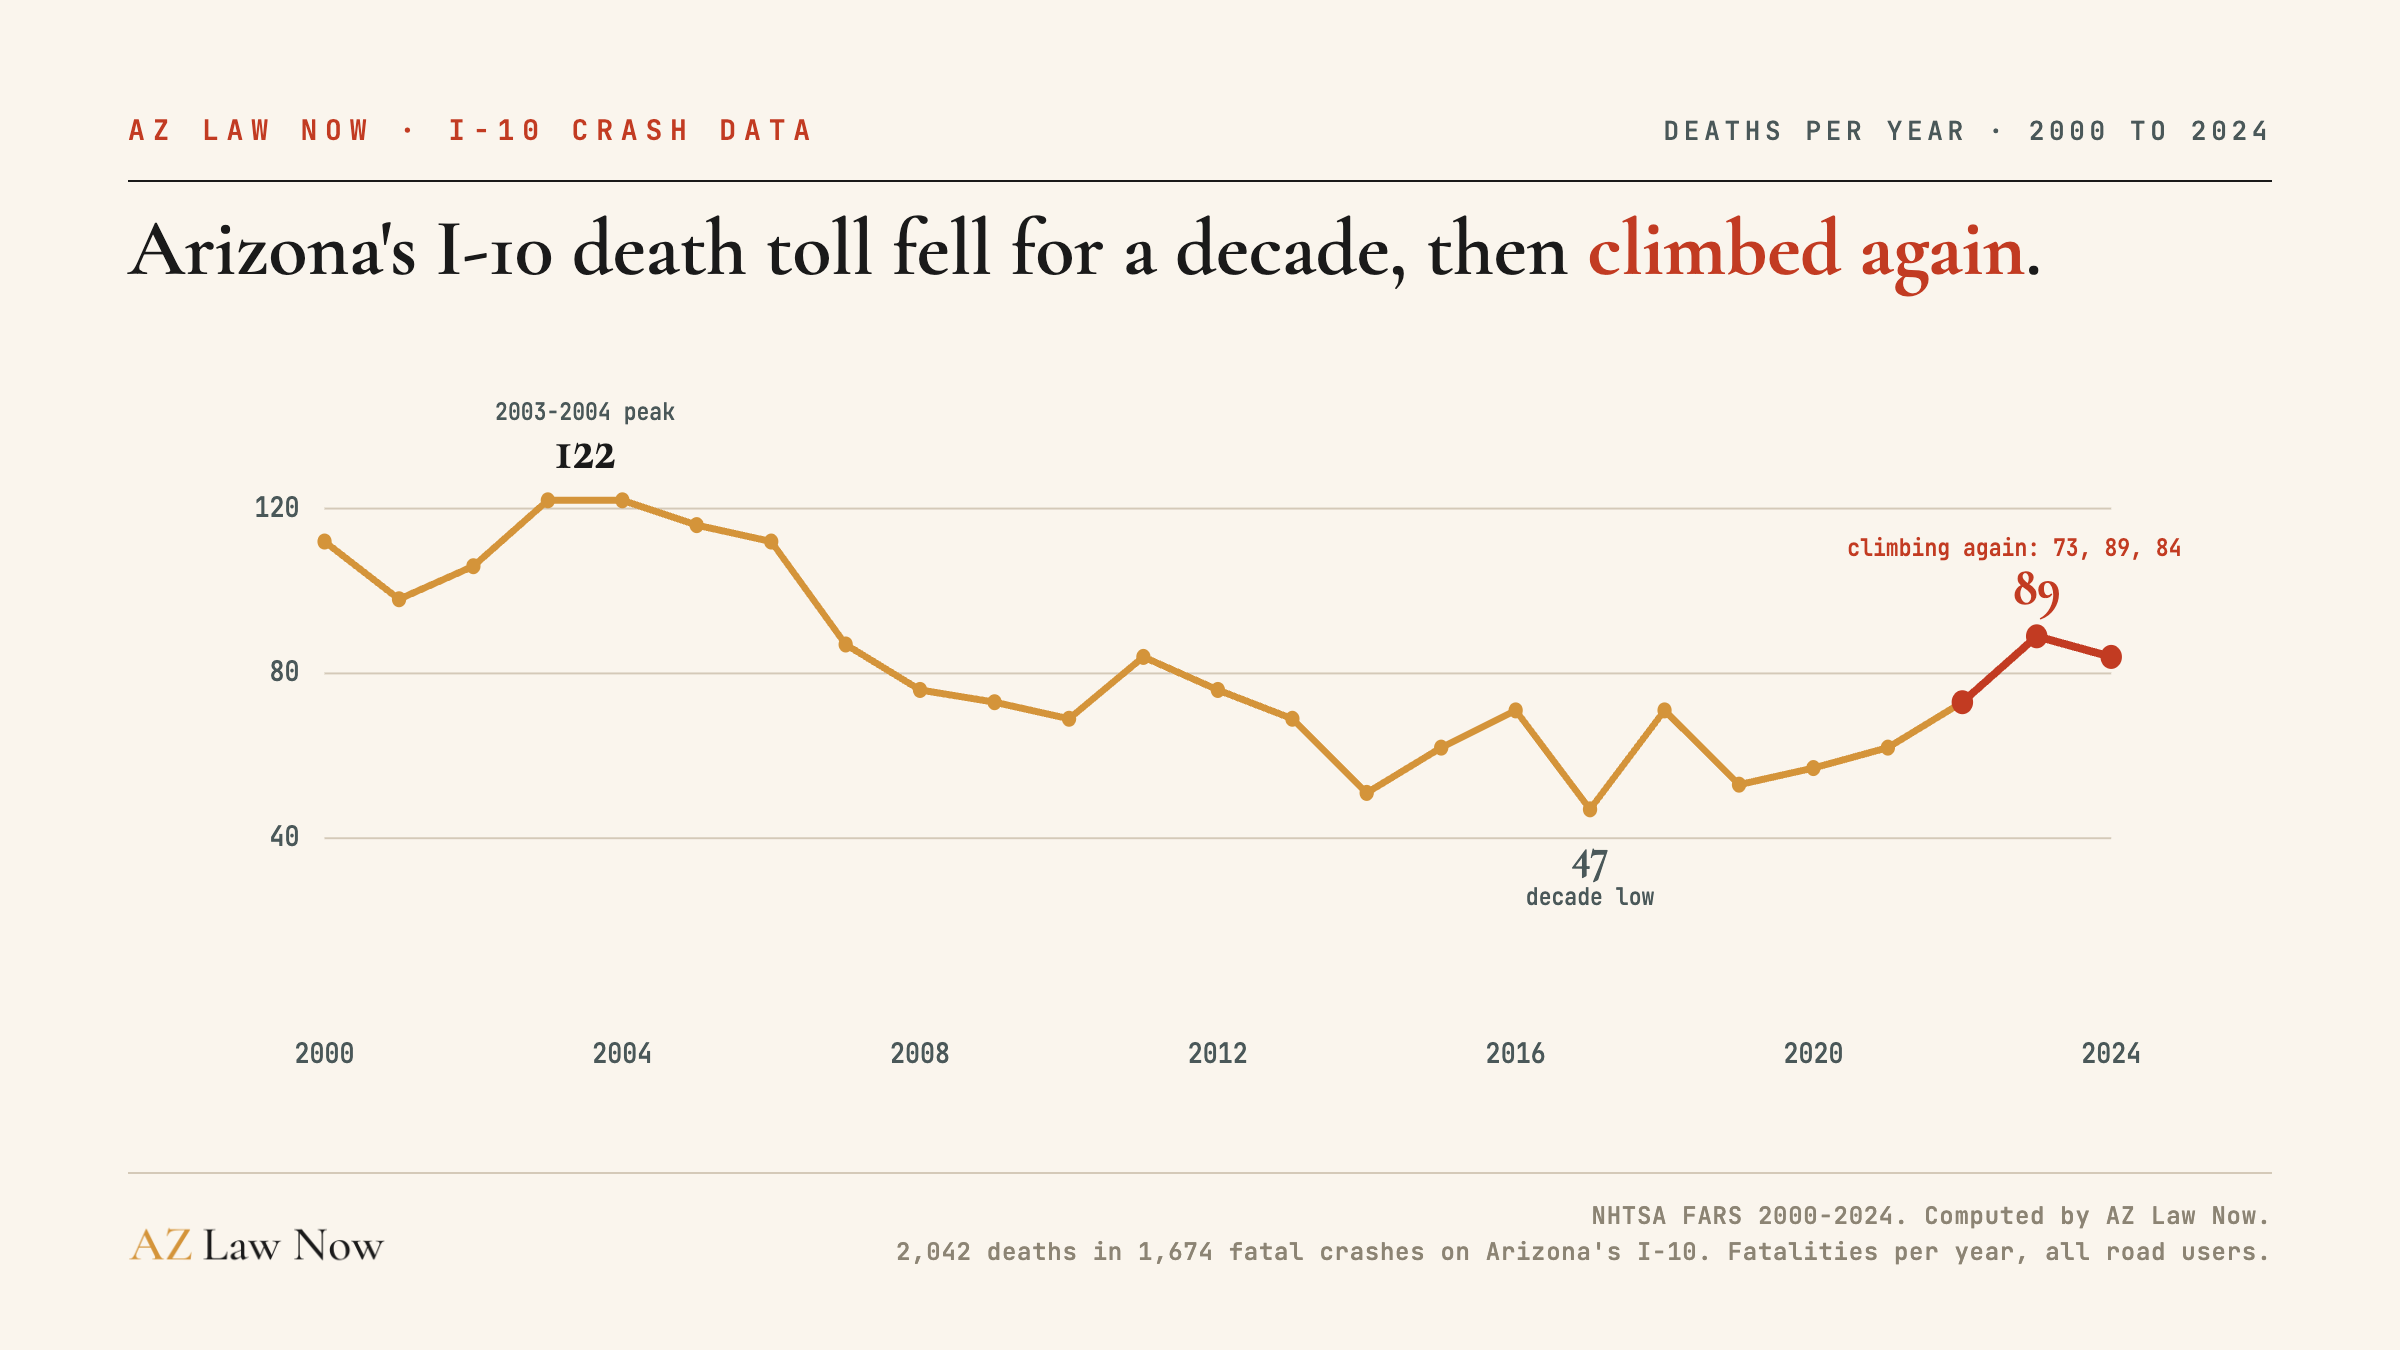
This isn’t a flat line. Arizona’s I-10 death toll peaked in the mid-2000s, with 122 people killed in 2003 and another 122 in 2004, the two worst years in the record.
Then it fell, steadily, for roughly a decade. By 2017 the yearly toll was down to 47 deaths, the lowest point in the 25-year record. If the story ended there, it would read as a slow, hard-won win.
It didn’t end there. The deaths have climbed three straight years: 73 in 2022, 89 in 2023, and 84 in 2024. Each of those years runs above the prior decade’s average.
The corridor isn’t back to its mid-2000s peak, but the decade of decline has reversed, and that reversal is the newest and most urgent thing in the data.
The federal file counts the deaths. It doesn’t explain the reversal. Whether the climb traces to post-2020 speeds, thinner enforcement, or a changing vehicle mix is a question the fatality census alone can’t answer, and it’s the one that matters most, because a cause you can name is a cause you can fix.
Rollovers, Not Pileups, Are I-10’s Biggest Killer
Ask someone to picture a deadly interstate crash and they’ll usually describe a head-on wreck or a chain-reaction pileup. The record shows something else.
743 of the 2,042 deaths, 36%, began with a rollover, a single vehicle overturning. That’s the largest first-harmful-event category on the corridor, and it outnumbers pedestrian strikes, guardrail hits, concrete-barrier impacts, and tree impacts put together.
The rest of the shape follows. Single-vehicle crashes account for 64.5% of the deaths, 1,317 of them, with rear-end crashes a distant second at 360. This is a road where the most common fatal crash is a driver losing control on their own, not two vehicles colliding.
Head-on crashes are the exception that proves the rule. They’re rare, just 4.9% of the fatal crashes, but they’re roughly 36% more lethal per crash than the corridor average, killing 1.66 people each against 1.22 overall, 136 deaths in all.
When a head-on happens on I-10, it’s far more likely to take more than one life.
Where the Deaths Cluster
The corridor isn’t uniformly dangerous. Some stretches carry far more of the toll than others, and they split into two very different kinds of place.
The deadliest is urban. The central and downtown Phoenix stretch, roughly 7th Street to 24th Street, holds about 65 deaths, the highest cluster in the record.
The I-10/I-17 Stack interchange follows with about 45, and the Papago Freeway near 75th Avenue in west Phoenix with about 43. These are dense, high-volume, high-conflict segments where merging and weaving concentrate the crashes.
The second kind is rural, and it’s just as deadly per stretch.
The Eloy and Picacho Peak area in Pinal County, and the Sacaton stretch through the Gila River Indian Community, each carry about 42 deaths. Out there the volume is lower but the speed is higher, the lighting is thinner, and help is farther away.
The Tonopah and Harquahala Valley run west of Phoenix adds about 32, and downtown Tucson’s Congress Street interchange about 30.
The federal fatality file records a milepost field, but on I-10 it’s unreliable enough that we don’t use it, a known data-quality issue.
Instead we clustered the crashes by their GPS coordinates, which cover about 80% of the record. So these stretch labels are inferred from latitude and longitude and describe an approximate zone, not an exact milepost.
The county and yearly totals include the full record. Only the stretch clustering leans on the roughly 80% of crashes with usable coordinates.
Maricopa Leads, but the Rural Counties Carry More Than Their Share
Sorted by county, the toll tracks population at the top and breaks from it below.
Maricopa County accounts for 754 deaths, 37% of the corridor’s total, the single deadliest county on the route, which fits a metro of nearly five million people. After that the pattern turns.
Pinal County carries 401 deaths, Pima 360, Cochise 280, and La Paz 247. Cochise and La Paz are small, rural counties, yet together they hold a quarter of the corridor’s deaths.
That’s the rural-interstate effect: long, fast, remote miles where a single loss of control has no shoulder, no lighting, and no quick rescue to soften it.
Dark Roads, Alcohol, and Speed
Three contributing factors run through the record, and the biggest one is simply the dark.
46% of the I-10 deaths happened in dark conditions, far above the share of traffic that moves overnight. Darkness on a fast interstate compresses reaction time and hides the drift toward a rollover until it’s too late to correct.
Alcohol shows up in 388 of the deaths, 19%. Speeding was flagged in 331, 16%, and that figure almost certainly undercounts the real total, because on a fatal crash the speeding driver has often died or left the scene, so the record never captures it. Read honestly, speed is a floor here, not a ceiling.
The deadliest crash on this corridor isn’t the one most drivers brace for. It’s a single vehicle, often at night, drifting and then rolling. Rollovers lead the toll, single-vehicle crashes make up nearly two-thirds of it, and 46% of the deaths come after dark.
The rural stretches through Pinal, Cochise, and La Paz counties concentrate that risk, because speed is higher and the margin for a recovered mistake is thinner.
The Legal Frame
These are fatal-crash statistics, not legal advice, but the record intersects with a set of Arizona deadlines worth stating plainly. Our guide to Arizona car crash law walks through how fault and recovery actually work in the state.
Arizona gives a family two years from the date of a crash to file a personal injury claim under ARS 12-542, and a wrongful death claim carries the same two-year deadline under ARS 12-542(2).
When a public entity is potentially involved, a road-design or maintenance decision for example, a separate and shorter 180-day Notice of Claim window applies under ARS 12-821.01.
That 180-day clock is no technicality. Missing it gives the public entity a complete defense to the claim, one it must raise or it waives.
The clock runs from the date the claim accrues, which is often but not always the date of the incident.
Arizona also follows pure comparative fault under ARS 12-2505, so a partially-at-fault driver’s recovery is reduced by their share of fault, never eliminated by it.
For the practical first steps after a crash on the corridor, Stephanie Ramirez’s first 48 hours after a car crash guide covers what to document before the evidence disappears.
How We Counted
Every figure on this page is computed by AZ Law Now from one named federal primary source: the NHTSA Fatality Analysis Reporting System, the federal census of every traffic death, for the years 2000 through 2024.
We isolated Arizona’s I-10 by state and route code, then audited each crash against its route identifier and excluded three GPS-contradicted false positives, so every one of the 1,674 crashes traces to a specific federal case record. Before publishing, we reconciled our Arizona statewide totals against the federal file year by year, and they matched.
The named breakdowns for 2000 through 2014 were rebuilt from the file’s raw numeric codes, because the plain-language labels aren’t populated in those earlier years. A few older legacy codes we could not resolve are left as undetermined rather than guessed.
The counts are the federal record. They don’t capture the survivors: the drivers and passengers who live through a rollover with a spinal or brain injury and carry it for the rest of their lives. The file counts the deaths. It doesn’t count the years that follow a survivable wreck.
Related Coverage
For the truck crashes alone, see our I-10 truck crash investigation, which found deaths in fatal large-truck crashes on I-10 rose 76% from 2015 to 2019 to 2020 to 2024.
For the single most dangerous three miles on the route, see our investigation of the I-10 Deck Park Tunnel corridor, which ADOT’s own consultants graded the worst safety tier on the scale.
For the crash-rate math west of Phoenix, see I-10 between Buckeye and Goodyear. The legal and process context lives in Ron DeBrigida’s Arizona car crash law guide and Stephanie Ramirez’s first 48 hours guide, both linked above.
Frequently asked questions
How many people have died on Arizona's I-10?
Are I-10 deaths in Arizona going up or down?
What is the biggest cause of death on Arizona's I-10?
Which Arizona county is deadliest on I-10?
What is the deadliest stretch of I-10 in Arizona?
How often do alcohol, darkness, and speed factor into I-10 deaths?
How dangerous are head-on crashes on Arizona's I-10?
What is the deadline to file a claim after a fatal crash on I-10 in Arizona?
Sources & references
- National Highway Traffic Safety Administration. (2025). Fatality Analysis Reporting System (FARS), 2000 to 2024. U.S. Department of Transportation. Retrieved from https://www.nhtsa.gov/research-data/fatality-analysis-reporting-system-fars
- Arizona State Legislature. ARS 12-542: Limitation of Actions, Personal Injury. Retrieved from https://www.azleg.gov/ars/12/00542.htm
- Arizona State Legislature. ARS 12-611: Wrongful Death Action. Retrieved from https://www.azleg.gov/ars/12/00611.htm
- Arizona State Legislature. ARS 12-821.01: Notice of Claim Against a Public Entity. Retrieved from https://www.azleg.gov/ars/12/00821-01.htm
- Arizona State Legislature. ARS 12-2505: Comparative Negligence. Retrieved from https://www.azleg.gov/ars/12/02505.htm