
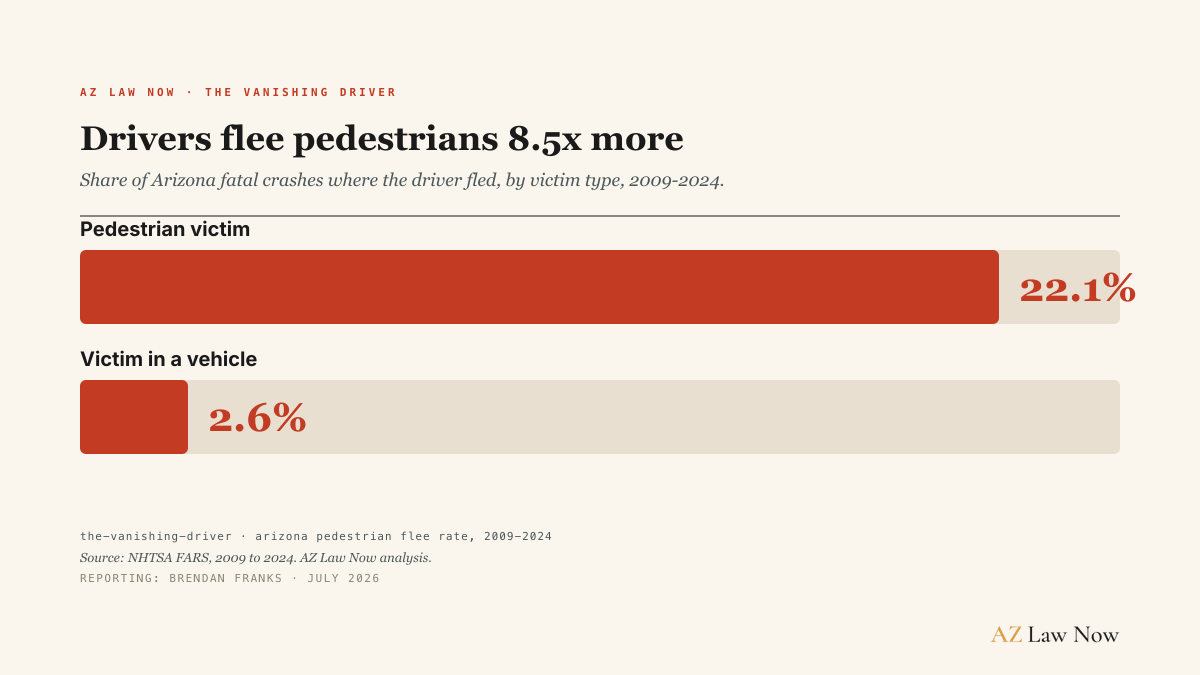
A driver who hits someone riding in a car stays at the scene 97 times out of 100 in Arizona. A driver who hits a pedestrian runs more than 1 time in 5.
That’s the finding I kept coming back to once I pulled the federal crash record for Arizona, 2009 through 2024, and split it by who the victim was. When the person killed was riding inside a vehicle, the driver fled just 2.6% of the time.
When the person killed was walking, the driver fled 22.1% of the time. A pedestrian’s killer is 8.5 times more likely to run.
Credit Where It’s Due
This isn’t a pattern we found first. Ed Beighe, a longtime Arizona bicycle and pedestrian safety advocate at Arizona Bike Law, spotted and wrote about this same flee-rate disparity.
He asked us to take his observation further: pull the full federal record ourselves and see if it held up statewide, county by county, year by year.
It does. Everything below comes from our own build of the National Highway Traffic Safety Administration’s Fatality Analysis Reporting System, independently reproduced from the raw federal crash-level and person-level files. Ed’s catch is what sent us looking. Read his original write-up at azbikelaw.org.
Why the Gap Matters More Than the Road
Staying at the scene isn’t a courtesy. It’s the moment a driver gets identified, tested for alcohol or drugs, and questioned by police. That driver can be charged in criminal court, and named in a civil claim that can force out records and testimony a criminal case never reaches.
A driver who flees erases all of that in one move. No roadside identification. No breath or blood test. Often, no name at all. Fleeing isn’t a second crime stacked on the first. It’s the act that destroys the evidence of the first.
Arizona already ranks 5th in the country for its pedestrian death rate, a pattern I’ve covered in the state-by-state rankings. This record adds a second burden on top of it: when the person killed was walking, the driver is far more likely to never be named.
The Corridor Where 1 in 3 Drivers Vanish
Arizona’s statewide rate is bad. One corridor runs worse, and it’s specific enough to draw on a map.
Crash locations cluster into a box across west and central Phoenix, along 35th, 43rd, and 51st Avenues, where they cross Indian School Road, Thomas Road, McDowell Road, and Camelback Road. Inside that box, the record holds 469 fatal pedestrian crashes from 2009 through 2024.
In 166 of them, the driver fled, a 35.4% rate, more than 1 in 3. That’s roughly 1.6 times the national rate for these crashes, and well above Arizona’s own 22.1%.
The single worst spot in the state sits near 35th Avenue and Indian School Road, 52 fatal pedestrian crashes on its own. Near 35th Avenue and Camelback Road, drivers fled 8 of the last 9 recorded pedestrian deaths.
This isn’t only a records story. Local news keeps covering Phoenix-area pedestrian hit-and-runs on their own, and that coverage piles up in the same crossings this corridor contains, block by block. The record names where drivers vanish most often. The ongoing coverage keeps confirming it, case by case.
Tucson Belongs in This Story Too
Pima County, home to Tucson, has the highest pedestrian hit-and-run rate of Arizona’s large counties: 24.9%, edging out Maricopa County’s 23.4%. Arizona’s two biggest urban counties both run between 23% and 25%. Rural and northern counties run closer to 12% to 15%.
Fleeing after killing a pedestrian is a big-city street behavior in this record, not a rural one.
A Rate That Keeps Climbing, Not Holding Steady
This isn’t a fixed problem. Arizona’s pedestrian flee rate started at 19.8% in 2009, climbed into the mid-20s within a decade, and peaked at 27.5% in 2015. It hit 26.0% again in 2022, then eased to 24.7% in 2023 and 21.5% in 2024.
The raw count of drivers who fled moved the same direction as the crash toll. Arizona counted 121 fatal pedestrian crashes in 2012. The 2022 peak was 296. The state got worse on both measures at once: more people killed while walking, and a larger share of their killers running.
The federal record changed how it flagged hit-and-run crashes over time, so this study holds strictly to the 2009-2024 window throughout and never compares to years before 2009.
Drivers Flee More Often After Dark
Darkness nearly doubles the odds a driver runs. Across Arizona’s fatal pedestrian crashes from 2009 through 2024, the after-dark flee rate was 24.5%. In daylight, it was 12.8%. At dawn or dusk, 17.1%.
In Maricopa County, 83.5% of pedestrian hit-and-run deaths, 364 of 436, happened after dark. And these aren’t unlit backroads. The single most common setting is a lit street, where the record holds more than 1,148 such crashes, with a 26.3% flee rate.
Darkness supplies cover for a driver who wants to disappear, even where the street lights are on.
684 People Left in the Road
Every percentage above describes a person. Since 2009, drivers who fled have killed 684 Arizonans on foot, about 43 a year, roughly one every 8 to 9 days. There’s no group a fleeing driver appears to spare:
- 104 were 24 or younger
- 128 were in their late twenties or early thirties
- 140 were in their late thirties or early forties
- 106 were in their late forties or early fifties
- 106 were in their late fifties or early sixties
- 96 were 65 or older
They were 466 men and 218 women. Women were left at the scene slightly more often, 24.2% of the time, against 21.1% for men. Young or old, man or woman, the record finds no victim a fleeing driver treats differently.
None of this says why any single driver ran. It does say the pattern isn’t rare, isn’t confined to one group of victims, piles up in corridors you can name, and has gotten worse over a decade and a half of consistent records.
A driver who stays after a fatal crash can be named, tested, and made to answer, in criminal court and civil court. A driver who flees is trying to make sure none of that happens. In Arizona, that attempt succeeds about 8.5 times more often when the victim was walking.
What the Law Does When the Driver Runs
Arizona treats a fatal hit-and-run as a felony under ARS 28-661. If the driver caused the crash, it’s a Class 2 felony carrying 3 to 12.5 years in prison. Under ARS 28-663, every driver is required to stop, provide name, address, and vehicle registration, and render reasonable assistance to anyone hurt.
Failing to render aid is a separate Class 6 felony.
Fleeing doesn’t erase the civil side of a fatal crash. A family can still bring a wrongful death claim under ARS 12-611 against a driver once identified, and Arizona’s statute of limitations gives two years under ARS 12-542.
Where the driver is never found, the family’s own uninsured motorist coverage, carried on the victim’s auto policy, may be the only path to compensation. Arizona doesn’t require UM coverage, and drivers can decline it in writing, which is exactly why so many families in these cases have no coverage to fall back on.
Families of pedestrians killed or hurt in an Arizona hit-and-run can reach AZ Law Now at (602) 654-0202 or through the contact form. An initial review investigates the scene, helps locate surveillance footage, and walks through UM/UIM insurance coverage under the family’s own policy. Intake is confidential. Representation is on contingency.
What I’m Watching
This record can’t assign fault in any single crash, and it can’t say which drivers will one day be named. What it can do is show the scale of the pattern, where it piles up, and how it’s trending, all sourced and checkable for anyone covering the next one.
I’ll keep tracking the corridor numbers as new years of federal data land, and I’m grateful to Ed Beighe for pointing at this pattern first. His original write-up is at azbikelaw.org.
Related Coverage
For the volume and solve-rate side of Arizona’s hit-and-run problem, read Hit-and-Run in Maricopa County. For the west Phoenix corridor’s broader pedestrian death toll, read West Phoenix’s Deadliest Patch. For the legal framework, see Ron DeBrigida’s guide to Arizona hit and run law and Stephanie Ramirez’s pedestrian crash action plan.
Frequently asked questions
How much more likely is a driver to flee after killing a pedestrian in Arizona?
Where in Arizona do drivers flee pedestrian crashes most often?
Which Arizona county has the highest pedestrian hit-and-run rate?
Does darkness make a driver more likely to flee?
How many people have been killed by a fleeing driver in Arizona?
What happens legally to a driver who flees a fatal pedestrian crash in Arizona?
Sources & references
- National Highway Traffic Safety Administration. Fatality Analysis Reporting System (FARS), person-level and crash-level records, Arizona, 2009-2024 https://www.nhtsa.gov/research-data/fatality-analysis-reporting-system-fars
- Arizona Department of Transportation. (2025). 2024 Arizona Motor Vehicle Crash Facts https://azdot.gov/sites/default/files/2025-07/2024-Crash-Facts.pdf
- Arizona Revised Statutes § 28-661 through § 28-663 https://www.azleg.gov/ars/28/00661.htm
- Ed Beighe, Arizona Bike Law. More About Missing Hit and Runs https://azbikelaw.org/more-about-missing-hit-and-runs/