
Three people died on foot on Phoenix-area roads in the past two weeks. A 40-year-old woman, killed by a hit-and-run driver at 43rd Avenue and Thomas Road on June 28. A man struck in the westbound lanes of I-10 at 67th Avenue on July 9, after he left his car following an earlier off-ramp crash.
A man hit by a tow truck at 7th Street and Thomas Road at 3:45 in the morning on July 10. He died too.
The news covers each one the same way. An overnight brief, a road closure, an investigation. Then the next one.
I went looking for the pattern behind the briefs. I took every pedestrian death in the federal crash census for Arizona, 25 years of them, mapped each one to a uniform grid of roughly 2-square-mile cells, and ranked the cells. The deadliest patch of ground in the entire state isn’t an abstraction.
It has street names.
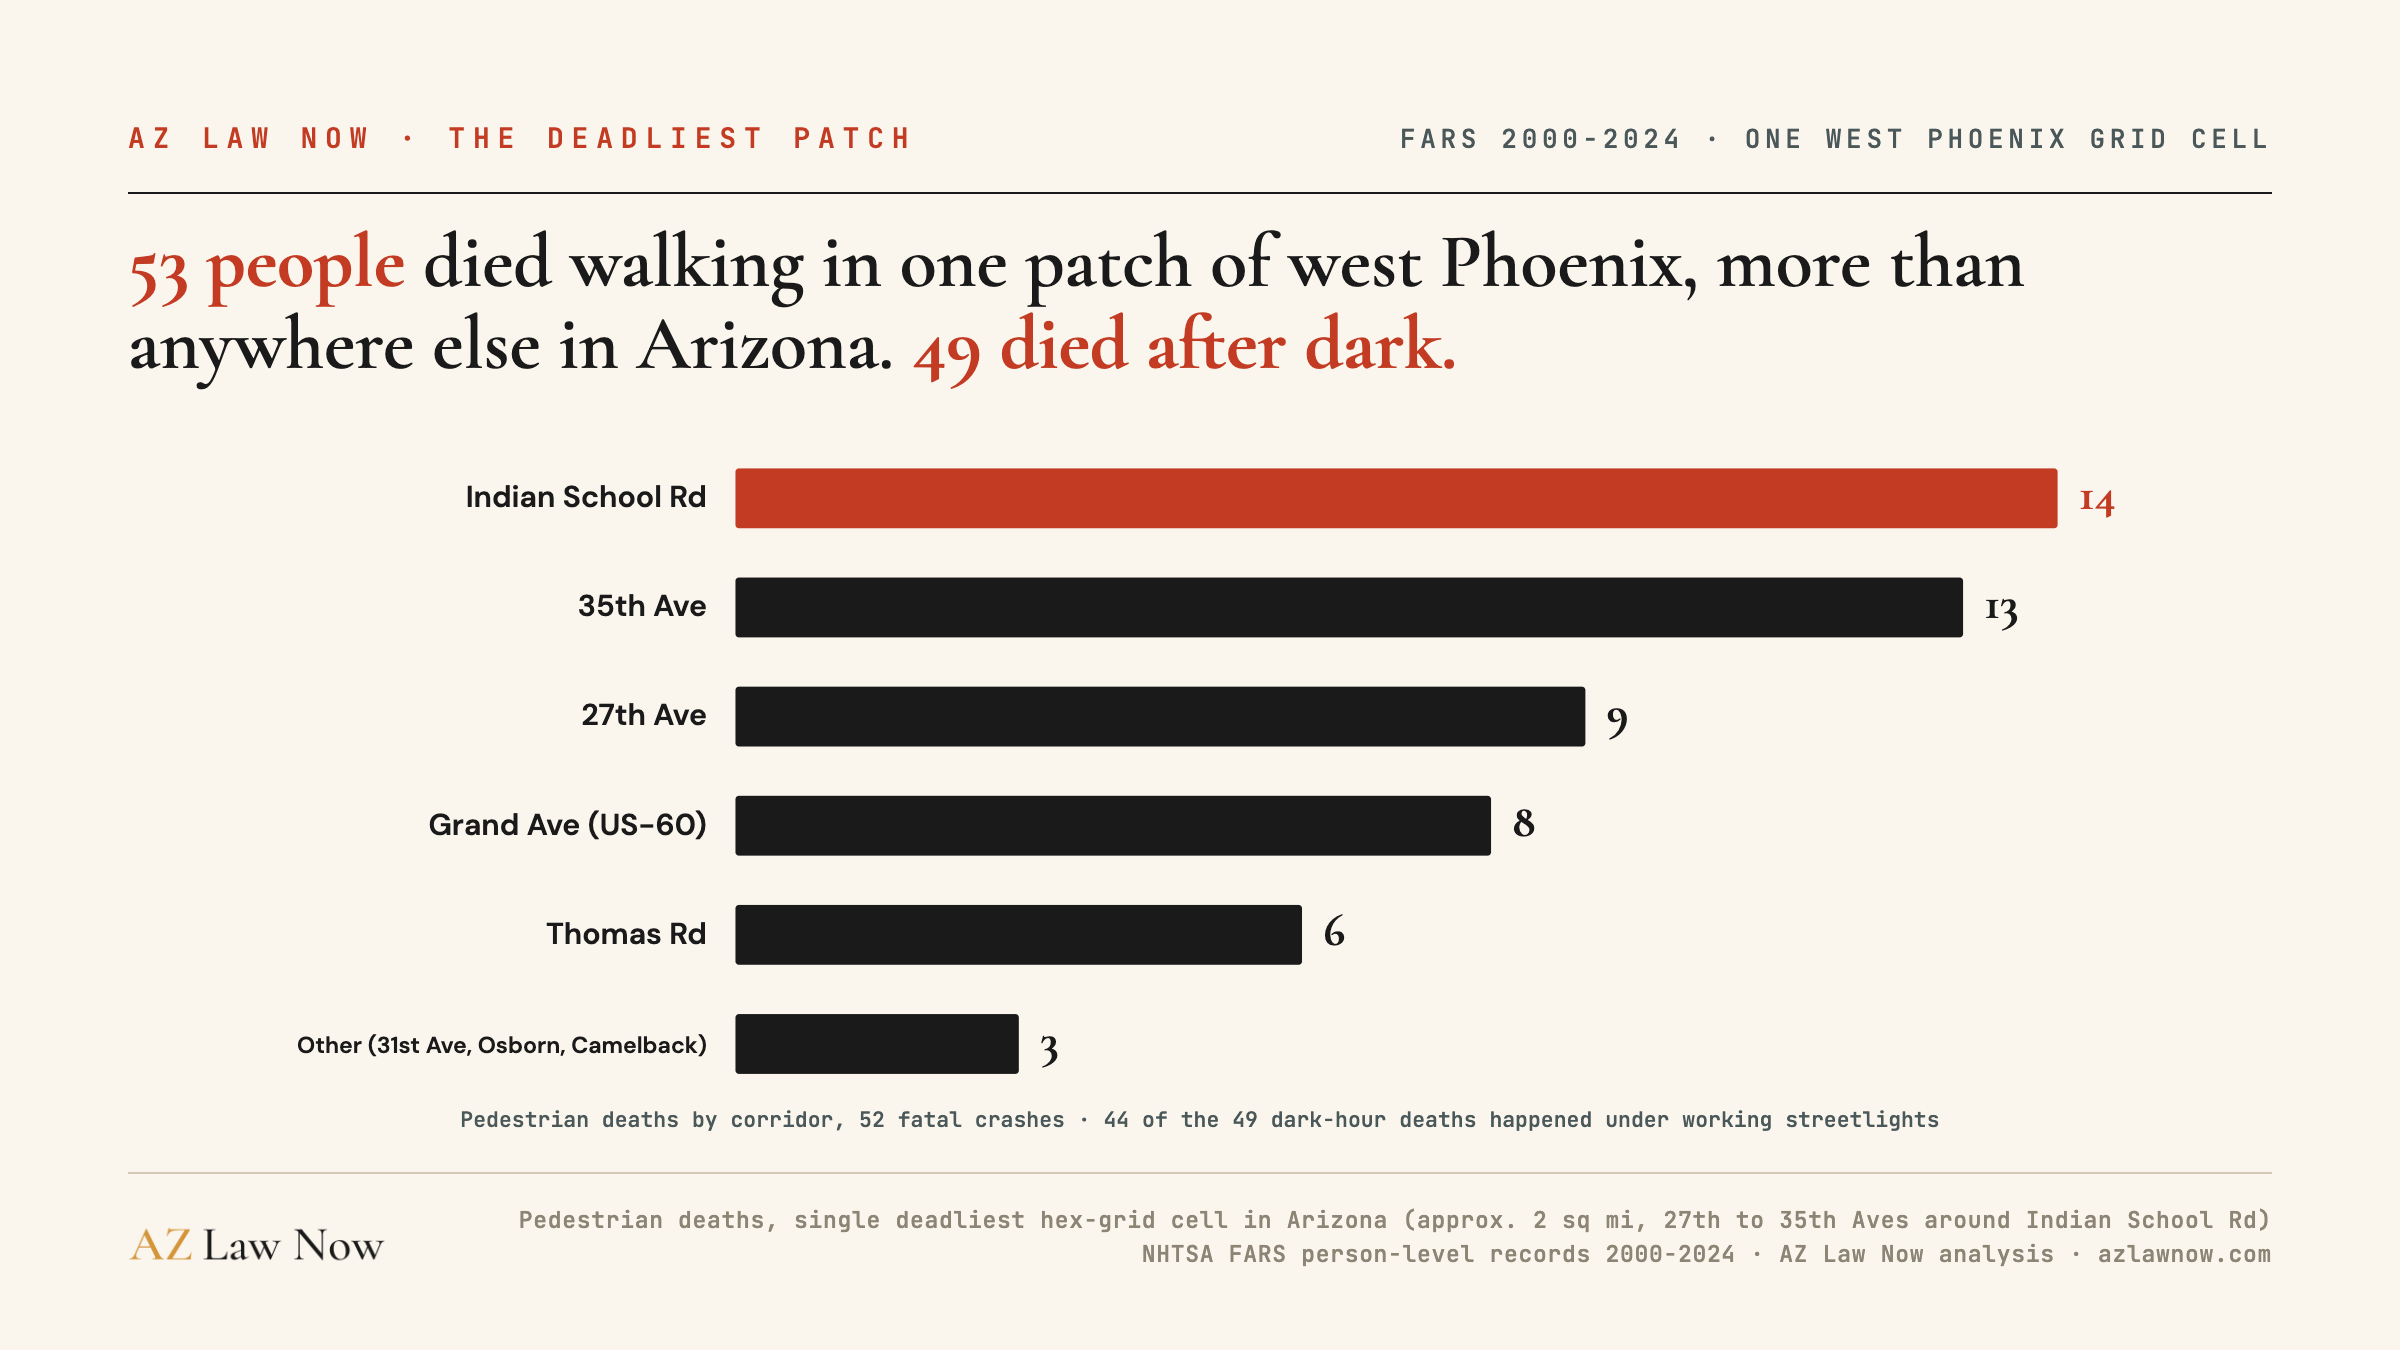
It’s west Phoenix, between roughly 27th and 35th avenues, from Thomas Road north past Indian School Road. Grand Avenue cuts through it diagonally. In that one patch, 53 people have been killed walking since 2000, in 52 separate crashes. No other spot in Arizona comes close. The second-deadliest cell, near Sky Harbor, recorded 45.
The Patch Has Street Names
The 53 deaths sort onto a handful of corridors, and they’re the streets anyone from this part of town already knows.
Indian School Road leads with 14. 35th Avenue follows with 13. 27th Avenue carries 9, Grand Avenue and its US-60 ramps carry 8, Thomas Road carries 6. The last 3 are on 31st Avenue, Osborn Road, and Camelback Road.
This is the Alhambra area of west Phoenix. It’s a working neighborhood built on the city’s mile-grid of wide arterials, and it has something most of the grid doesn’t: Grand Avenue slicing through at a diagonal.
Where Grand crosses the grid, it makes the six-legged intersections Phoenix drivers know from 35th Avenue and Indian School Road, crossings with more conflict points, longer crossing distances, and signal timing that has to serve three streets at once.
I’ve reported on this area before. Phoenix’s own Road Safety Action Plan, the Vision Zero document the City Council adopted in September 2022, ranked the city’s two worst intersections on Indian School Road, at 75th and 67th avenues, farther west. The federal data adds a harder fact.
Follow Indian School Road east from those intersections and you enter the patch where more people have died on foot than anywhere else in the state.
The Lights Were On
The number that should end the easy explanation: 49 of the 53 people killed here died after dark. That’s 92.5%, against 76.7% for Arizona pedestrian deaths overall.
But this isn’t a missing-streetlight story. Of those 49 dark-hour deaths, the crash reports code 44 as happening in a lighted area. The lights were on. People died under them anyway.
Statewide, I’ve written before about how 76% of Arizona’s pedestrian deaths happen in darkness, mostly on wide arterials. This patch is that pattern, concentrated. A streetlight helps a driver see a person at 30 mph.
It does much less at the speeds a seven-lane arterial invites, across the distances a person has to cover to cross one.
The road records agree. Every one of the 28 deaths here with a recorded road classification happened on an arterial, a principal or minor one, and zero happened on a local residential street. Of the 15 deaths with a recorded speed limit, 14 were on 40 mph roads.
The older records don’t carry those fields, so I state them against the records that do.
Who Died Here
These weren’t mostly children, and they weren’t mostly the elderly. The median age of the 53 people killed in this patch is 42. The youngest was 16. The oldest was 79. Twenty-six of the 53 were between 25 and 44, and another 19 were between 45 and 64.
That’s the profile of people walking because that’s how they get places. To the bus stop on 35th Avenue. To the store across Indian School Road. Across five lanes of Grand Avenue traffic, at night, in the gap between signalized crossings that can sit a half mile apart.
It’s Not Slowing Down
Split the 25 years into periods and the count climbs toward the present. Fifteen of the deaths came in 2000 through 2009. Twenty-one came in 2010 through 2019. Seventeen came in 2020 through 2024, five years, not ten.
That’s an average of 3.4 deaths a year in this one patch since 2020, the fastest pace in the record. Any single year here is a small number, 1 to 6 deaths, and I won’t hang a claim on one year. The 25-year total, and the direction, are stable.
Arizona as a whole remains one of the deadliest states in the country to be a pedestrian, with 263 people killed walking statewide in 2024, per ADOT’s 2024 crash facts. This patch is where that statewide number has concentrated hardest, for 25 straight years.
The Fix Stops at 39th Avenue
Here’s the accountability question this map raises.
Phoenix knows Indian School Road kills people. The city documented it, ranked it, and in December 2023 won $24.96 million in federal money for the ReVISIONing Indian School Road project: corridor lighting, raised medians, protected crossings, new signals. I covered that project and its 2028 construction date in the deadliest-intersections report referenced above.
The project rebuilds Indian School Road from 91st Avenue to 39th Avenue.
The deadliest patch in Arizona, by the federal government’s own 25-year crash census, lies east of 39th Avenue. Every one of the 53 deaths in this analysis falls outside the project’s eastern boundary.
The corridors that carried them, Indian School east of 39th, 35th Avenue, 27th Avenue, Grand Avenue, Thomas Road, aren’t in that project’s scope.
A boundary has to fall somewhere, and the 91st-to-39th corridor the city is rebuilding has its own brutal record.
But the federal data says the single worst concentration of pedestrian deaths in the state starts where the funded fix ends. Residents of Alhambra are entitled to ask what the plan is for their mile of the road.
I’m sending the City of Phoenix Street Transportation Department this analysis and asking two questions. What pedestrian-safety work is planned or funded for Indian School Road east of 39th Avenue, and for the 27th and 35th Avenue corridors between Thomas and Camelback. And whether the city’s High Injury Network work has flagged this same concentration.
I’ll update this report with the answers.
What This Means If You Were Hurt Here
Arizona is a pure comparative negligence state under ARS 12-2505. If you were hit walking, you can recover compensation even if an insurer argues you share fault, and they will argue it. Your percentage of fault reduces your recovery. It doesn’t eliminate it.
The statute of limitations is two years under ARS 12-542, and a corridor’s documented crash history, like the record in this report, is exactly the kind of evidence that matters when the argument is about whether a road was reasonably safe to cross.
An Arizona pedestrian crash attorney can put that kind of record to work while the two-year clock is still running.
The June 28 death at 43rd and Thomas was a hit-and-run. Arizona law (ARS 28-661 through 28-665) makes fleeing a fatal crash a Class 2 felony, and if a driver is never found, your own uninsured motorist coverage may apply, often with a contractual deadline shorter than the two-year statute.
Pedestrians and families of people struck while walking in Phoenix can reach AZ Law Now at (602) 654-0202 or through the contact form. Intake is confidential. Representation is on contingency.
Methodology, Briefly
This analysis uses the National Highway Traffic Safety Administration’s Fatality Analysis Reporting System, the federal census of fatal crashes, for 2000 through 2024.
We mapped the 3,942 Arizona pedestrian deaths with usable coordinates (89% of the state’s 4,409 in the period) onto a uniform hexagonal grid of roughly 2-square-mile cells and ranked the cells by deaths.
The west Phoenix cell described here is the state’s deadliest, with 53 deaths across 52 crashes, and the top eight cells statewide all fall in central and west Phoenix.
A cell is a patch of ground, not an intersection, and nothing in this report attributes fault in any individual crash. Lighting figures use the FARS light-condition code, recorded for all 53 deaths.
Road class and speed limit exist only in later-year records, and shares for those fields are stated against the records that carry them. Full sourcing is listed below.
Related Coverage
The statewide design pattern and the city’s own Indian School Road ranking are covered in the two reports linked above. For the West Valley’s growth-versus-infrastructure gap, read the West Valley dangerous intersections report. For the rail crossings at this patch’s southeast corner, read the 27th Avenue and Thomas Road BNSF crossing investigation.
For the legal framework, see Ron DeBrigida’s guide to Arizona pedestrian law and Stephanie Ramirez’s pedestrian crash action plan.
Frequently asked questions
Where is the deadliest area for pedestrians in Arizona?
How many pedestrians have been killed in this part of west Phoenix?
Why do so many pedestrians die near Indian School Road and 27th to 35th Avenue?
Is the city fixing this stretch of Indian School Road?
Can I recover damages if I was hit while walking in Phoenix?
What if the driver who hit me left the scene?
Sources & references
- National Highway Traffic Safety Administration. Fatality Analysis Reporting System (FARS), 2000-2024 person-level records https://www.nhtsa.gov/research-data/fatality-analysis-reporting-system-fars
- FOX 10 Phoenix. (2026, June 29). Pedestrian killed, driver hurt in early morning Phoenix hit-and-run https://www.fox10phoenix.com/news/pedestrian-killed-driver-hurt-early-morning-phoenix-hit-and-run
- Arizona's Family (AZFamily). (2026, July 9). Man killed after running into I-10 traffic in west Phoenix https://www.azfamily.com/2026/07/09/multiple-lanes-blocked-i-10-west-phoenix-after-deadly-crash/
- Arizona's Family (AZFamily). (2026, July 10). Man dies after being hit by tow truck overnight in central Phoenix https://www.azfamily.com/2026/07/10/police-investigating-after-man-hit-by-car-overnight-phoenix/
- City of Phoenix. (n.d.). Indian School Road projects (ReVISIONing Indian School Road, 91st Ave to 39th Ave) https://www.phoenix.gov/administration/departments/streets/initiatives/projects-studies/indian-school-road.html
- City of Phoenix Street Transportation Department. (2022). Road Safety Action Plan (Vision Zero), adopted September 7, 2022 https://www.phoenix.gov/content/dam/phoenix/streetssite/documents/vision_zero_road_safety_action_plan.pdf
- Arizona Department of Transportation. (2025). 2024 Arizona Motor Vehicle Crash Facts https://azdot.gov/sites/default/files/2025-07/2024-Crash-Facts.pdf