Update, July 2, 2026: Arizona launched Arrive Alive Arizona, a five-year statewide traffic safety campaign, on June 29. Our new investigation measures it against Arizona’s 25-year fatality record, where Maricopa County now carries half the state’s traffic deaths.
These roads weren’t built for people on foot. They were built for cars moving fast through sprawl. And in the years since Buckeye, Goodyear, and Avondale started growing, the infrastructure hasn’t caught up to the population. Not even close.
The Numbers
Arizona isn’t just a bad state for pedestrians. It’s consistently one of the worst in the country.
ADOT’s 2024 Crash Facts report recorded 263 pedestrian fatalities statewide. The five-year picture: 235 in 2020, 261 in 2021, 307 in 2022, 273 in 2023, and 263 in 2024. The count peaked in 2022 and has since declined, but the structural conditions that drive these crashes haven’t changed.
Maricopa County carries most of the weight. Roughly 60% of pedestrian deaths in Arizona happen in Maricopa. And the West Valley’s share of that total keeps growing as population surges outpace road safety improvements.
GHSA data showed Arizona had the second-highest pedestrian fatality rate in the nation in 2022, at 4.05 deaths per 100,000 residents, behind only New Mexico. That’s not a ranking anyone’s trying to top.
Why the West Valley Is Different
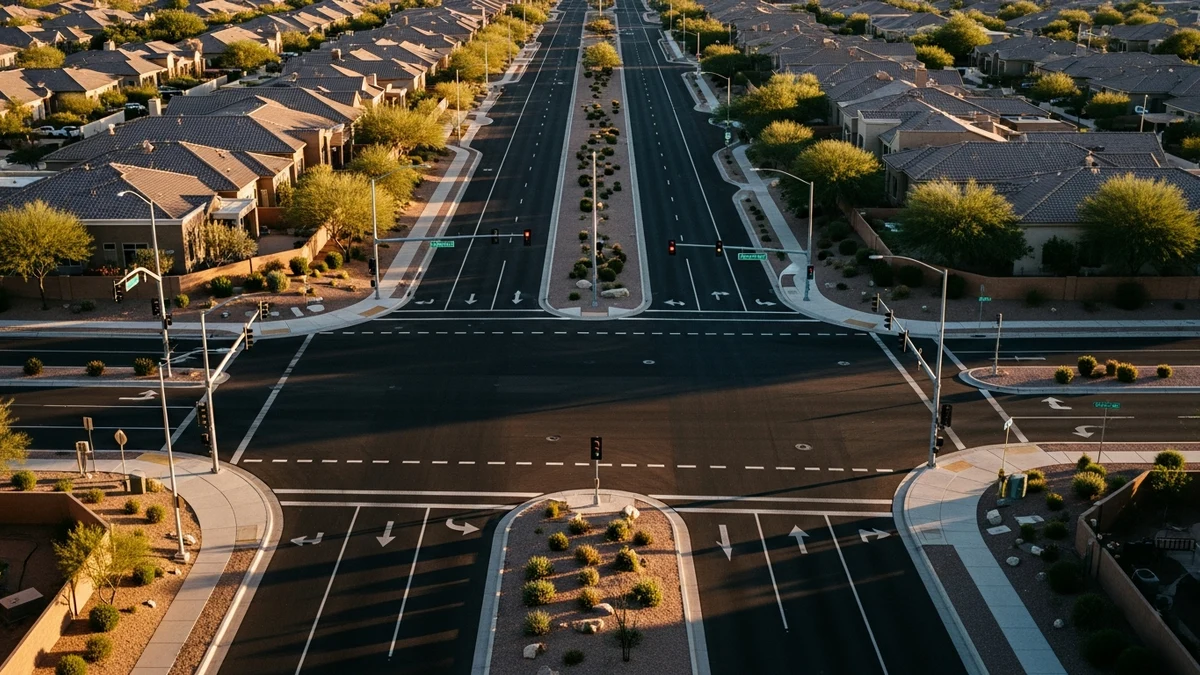
Phoenix proper has its own pedestrian safety problems. But the West Valley has a specific structural issue that makes things worse: suburban arterial roads built to move traffic through farmland that’s now full of subdivisions, schools, and strip malls.
These aren’t narrow city streets with signals every block. They’re four- and six-lane divided roads with speed limits of 45 to 55 mph, minimal lighting, long distances between crosswalks, and stretches where the sidewalk just stops.
People walk on these roads anyway. They walk to bus stops. They walk to convenience stores. They walk home from work at dusk. And the roads weren’t designed to accommodate any of them.
MAG’s regional transportation planning tracks crash patterns across the metro area. Several West Valley corridors appear consistently in pedestrian safety data. Not because drivers here are worse. Because the road design makes crashes almost inevitable when someone’s on foot.
McDowell Road and Litchfield Road, Goodyear
This intersection sits at the border of Goodyear’s older commercial corridor and newer residential developments to the south. McDowell is a six-lane divided road here. Litchfield carries heavy north-south commuter traffic between I-10 and the Loop 303.
The problem is easy to see from the road design. Turn lanes extend the crossing distance. The signal timing prioritizes vehicle throughput. And pedestrians crossing McDowell have to navigate roughly 100 feet of asphalt between curbs.
The speed limit on McDowell approaching this intersection is 45 mph. Pedestrian safety research consistently shows that a pedestrian struck at 45 mph faces a roughly 75% fatality risk. At 25 mph, that drops to around 10%.
Indian School Road and Dysart Road, Avondale
Indian School and Dysart is a high-crash corridor because of what surrounds it. There’s a middle school within a quarter mile. A park. An apartment complex. People on foot aren’t rare here. They’re constant.
But the road design treats them like an afterthought. Indian School is four lanes with a center turn lane and no median refuge. The crosswalk distance is long. There’s no pedestrian countdown signal on the south leg. And the lighting is sparse after sunset.
ADOT crash data for this corridor shows pedestrian-involved collisions within a concentrated stretch. The pattern is consistent with what happens when safe crossing options are too far apart: people cross where they happen to be, not where the infrastructure says they should.
This is a pattern across the West Valley. When you make the safe crossing inconvenient, people improvise. And the improvisation kills them.
Van Buren Street and Avondale Boulevard
Van Buren through Avondale carries a reputation. It’s a wide, fast state route (SR-80) that doubles as a local commercial street. The speed limit is 45 mph through stretches lined with businesses, bus stops, and residential side streets.
The intersection with Avondale Boulevard is the hub of this problem. Heavy turn volumes. Limited pedestrian infrastructure. Bus riders crossing Van Buren to reach stops on the opposite side.
Valley Metro’s Route 3 bus runs along Van Buren here. That means people are crossing this road at locations that aren’t crosswalks because the bus stop sits on one side and their destination is on the other. ADOT data shows repeated pedestrian crashes along this corridor, especially between 6 p.m. and 8 p.m.
The crossing distances between signalized intersections along this stretch of Van Buren are long enough that most people don’t walk to the nearest signal. They cross mid-block. Sometimes they get killed.
Yuma Road and Watson Road, Buckeye
Yuma Road (MC 85) is the commercial spine of old Buckeye. Watson Road connects residential neighborhoods to the south with commercial areas and the freeway interchange to the north.
The intersection itself isn’t geometrically complicated. But the problems stack up. There’s no dedicated pedestrian signal phase. The crosswalk markings are faded in places. Lighting is inadequate for the volume of pedestrian traffic, especially on the south side.
Buckeye’s population grew from roughly 79,000 in 2020 to over 110,000 by 2025. That’s a significant jump in five years. The roads didn’t grow with it. Yuma Road through central Buckeye still operates essentially the same way it did when the population was half this size.
What’s changed is the number of people walking. More families. More kids walking to school. More people without cars relying on transit and foot travel. ADOT records show a pattern of pedestrian-involved crashes in the Buckeye area consistent with growing pedestrian activity on roads not designed for it.
MC 85 and SR-85 Intersection Area
This is one of the most concerning zones on this list, and it’s not a single intersection. It’s a corridor.
MC 85 (also known as Buckeye Road west of the city) meets SR-85 in an area where highway-speed traffic converges with local road access. The speed limit approaches 55 mph on SR-85. MC 85 carries heavy truck traffic. And the interchange area has limited pedestrian facilities.
People cross near this junction to access businesses, a gas station, and residential areas on either side of SR-85. There’s no pedestrian bridge. No underpass. The nearest signalized crosswalk is far enough away that almost nobody uses it.
When pedestrian crashes happen in this corridor, the speeds involved mean the outcomes are almost always severe injury or death. The truck traffic component adds additional risk. SR-85 is a major trucking corridor connecting I-10 to I-8 and points south, and the weight differential between a commercial vehicle and a person on foot makes any collision at highway speeds unsurvivable.
Comparing the Data Across Intersections
Here’s what the five intersections share and where they differ.
Every single one has a speed limit of 40 mph or higher. Every single one has some form of pedestrian infrastructure deficiency. The pattern isn’t subtle.
The Bus Stop Problem
There’s an angle to this that doesn’t get enough attention. Bus stops.
Valley Metro operates bus routes along several of these arterials. Route 3 runs on Van Buren. Route 17 runs on McDowell. The bus stops sit on one side of the road. The riders’ homes, jobs, and grocery stores sit on the other.
When a bus stop is located on a six-lane arterial with no nearby crosswalk, every bus rider has to make a choice: walk a quarter mile to the nearest signal, or cross right here. Tired people coming home from work don’t walk the quarter mile. Neither do parents with kids. Neither do elderly riders.
ADOT crash data shows clusters of pedestrian crashes near bus stop locations on high-speed arterials. This isn’t coincidence. It’s cause and effect. You put a bus stop on a road designed for 50-mph traffic with no safe crossing, and people get hit.
The fix isn’t complicated. Pair every bus stop on a high-speed road with a marked crosswalk and a pedestrian-activated signal. Cities across the country have done this. It works. The West Valley hasn’t.
Who’s Walking These Roads
The assumption most people make about pedestrians in the West Valley is wrong. They picture someone choosing to walk for exercise or recreation. That’s not who’s dying on these roads.
The pedestrians showing up in ADOT crash data are disproportionately people without reliable access to a car. Lower-income residents. Elderly residents who’ve stopped driving. Teenagers too young for a license. People walking to the bus, from the bus, or to one of the few businesses within walking distance of their neighborhood.
In Buckeye, parts of the city south of I-10 have limited transit access and long distances between commercial areas. Residents in newer subdivisions near Watson Road and Yuma Road sometimes have to walk along arterials without sidewalks just to reach a grocery store. That’s not recreation. That’s necessity.
Arizona doesn’t collect pedestrian income data in crash reports. But the geographic pattern is clear. The pedestrian crashes cluster in areas where walking isn’t a lifestyle choice. It’s a transportation reality. And the roads in those areas are the least equipped to protect people on foot.
The Time-of-Day Problem
Across all five of these corridors, the same pattern repeats. Most pedestrian crashes happen in the evening.
ADOT 2024 Crash Facts identifies 6 p.m. to 7 p.m. as the peak hour for pedestrian crashes statewide. That’s the transition from dusk to early darkness, when visibility drops but traffic volumes stay high, when people are walking home from work or from the bus stop, and when drivers are tired, distracted, and rushing.
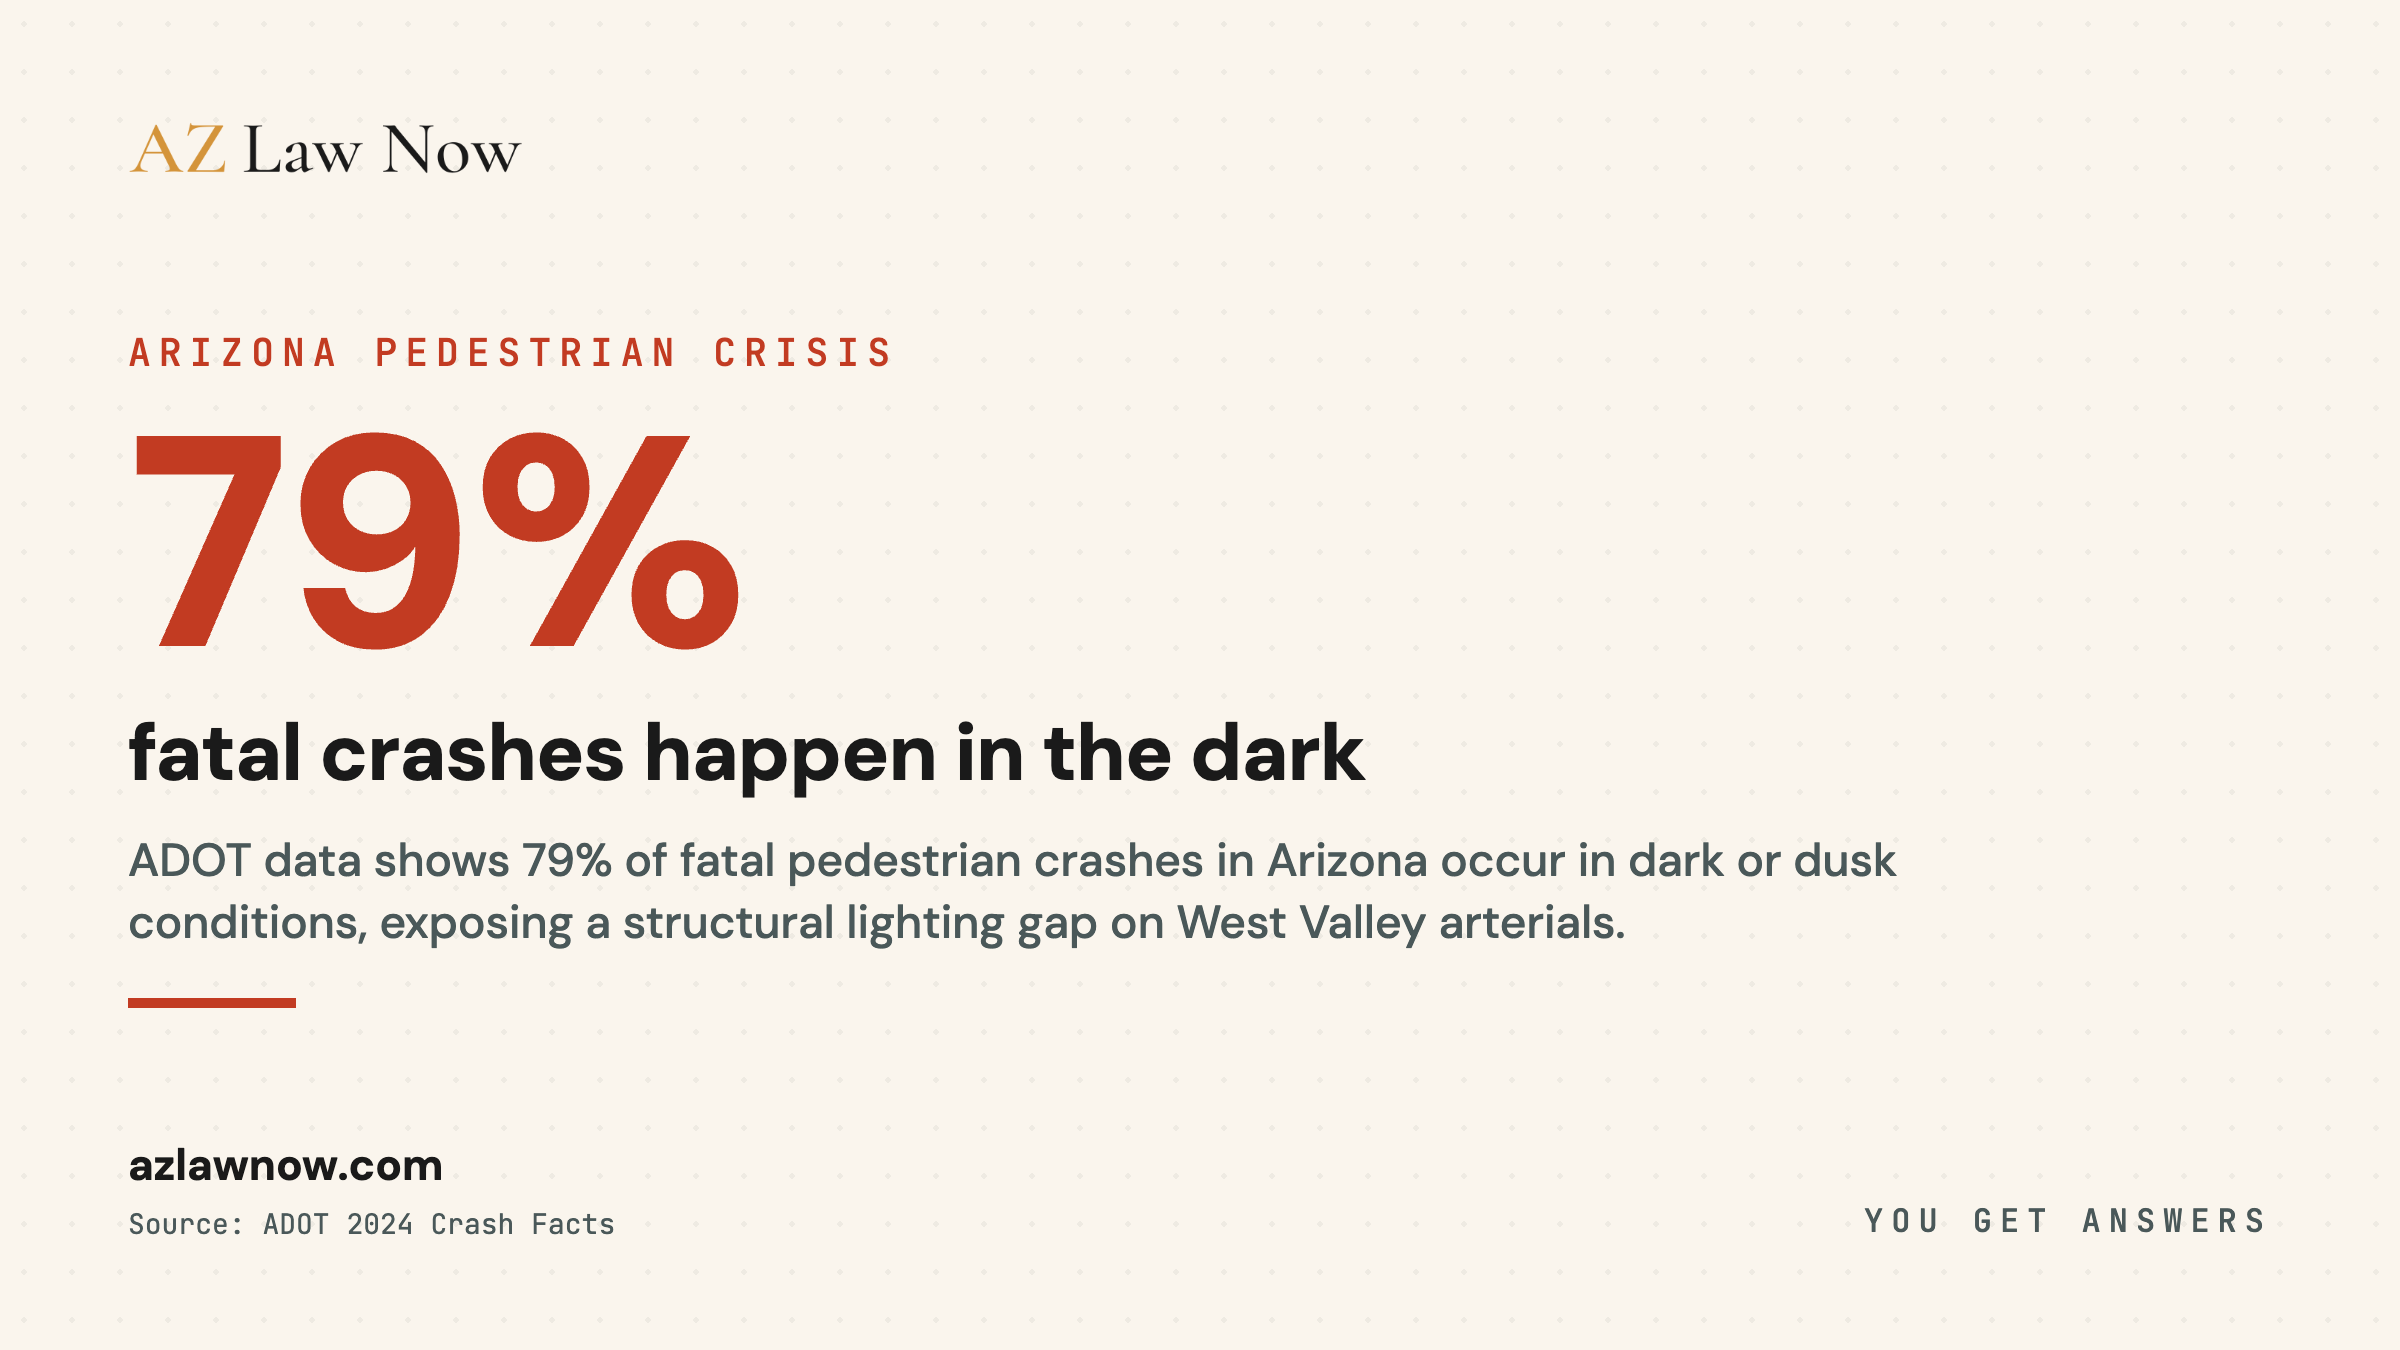
Arizona’s 2024 data shows approximately 79% of fatal pedestrian crashes statewide occurred in dark or dusk conditions. The GHSA 2024 report puts the national figure at roughly 77% for 2022. Arizona’s wide, high-speed arterials amplify this risk. There’s no buffer. No tree canopy. No traffic calming. Just wide-open asphalt and headlights.
Roughly three out of four fatal pedestrian crashes in Arizona occur in dark or dusk conditions, according to ADOT 2024 Crash Facts. If you’re walking along a West Valley arterial after sunset, you’re in the highest-risk window. Wear reflective clothing. Use a flashlight or phone light. Cross only at signalized intersections when possible.
What Makes a Road Deadly for Pedestrians
It’s not one thing. It’s a combination of design choices that individually seem minor but together create kill zones.
Speed is the first variable. Pedestrian fatality risk rises sharply with vehicle speed. The pedestrian safety research literature consistently places the risk at around 10% when struck at 25 mph, roughly 30% at 35 mph, and approximately 75% at 45 mph. Most West Valley arterials sit right at that upper threshold.
The second variable is how far you have to walk to get across. Six-lane arterials like Grand Avenue, Bell Road, and Northern Parkway run 90 to 110 feet curb to curb with turn lanes included. A healthy adult walking at 3.5 feet per second needs 25 to 31 seconds to make it across. That’s a long time when right-turning drivers aren’t checking crosswalks and the walk phase is already counting down.
Distance between crosswalks compounds the problem. When the next signalized crossing is a quarter mile or more away, people cross wherever they can. Every time. Mid-block fatalities in the West Valley are almost always people doing exactly that, walking from a bus stop to an apartment complex across a 45-mph arterial with nowhere legal to cross nearby.
The last two factors are infrastructure gaps. Sidewalk connectivity fails in pockets across Buckeye, Goodyear, Avondale, and Surprise, where ADOT and MAG data both reflect sections of arterials where the sidewalk simply ends. Pedestrians walk in the road shoulder or in the dirt. Lighting fails along the same corridors. Overhead street lights illuminate the travel lanes for drivers, not the road edge for pedestrians.
Growth Without Infrastructure
Here’s the core problem. Buckeye was the fastest-growing city in the United States from 2020 to 2023 by percentage, according to Census Bureau data. Goodyear and Avondale aren’t far behind. New subdivisions go up every year. Thousands of new residents arrive.
But the arterial road network serving these cities was designed decades ago for a fraction of the current population. Widening roads and adding signals takes years of planning, funding, and construction. New sidewalks and crosswalks lag even further behind.
The result is a mismatch. Modern residential density served by old rural road infrastructure. Families walking along roads that were built when the nearest house was a mile away.
MAG’s regional transportation plan acknowledges the problem. Federal Highway Administration pedestrian safety action plans identify the same gaps. Reports get written. Plans get made. But the intersections keep showing up in crash data because the physical changes take years to arrive.
What Would Actually Help
The interventions that work aren’t mysterious.
None of this is new technology. None of it’s expensive relative to road widening projects. It’s a question of priority.
What to Do If You’re Hit
If you or someone you know is struck by a car while walking in the West Valley, the immediate priorities are medical care and documentation. Call 911 first. Don’t move if you suspect a spinal injury. Get the driver’s information if they stay. Photograph the scene, the intersection, the signal state, and any missing infrastructure.
Arizona law gives pedestrians the right of way in crosswalks. But even if you weren’t in a crosswalk, Arizona’s comparative negligence rules mean you can still recover damages if the driver was partially at fault. A 45-mph speed limit through a commercial corridor with no pedestrian infrastructure is evidence that matters.
Our team at AZ Law Now handles pedestrian crash cases across Buckeye, Goodyear, Avondale, and the broader West Valley. We investigate the intersection, pull the crash report, check signal timing records, and look at whether the road design itself contributed to the crash.
AZ Law Now can be reached at (602) 654-0202 or through the contact form. Intake is confidential. Representation is on contingency.
Related Coverage
For the legal and process context, see Ron DeBrigida’s guide to Arizona pedestrian law, Stephanie Ramirez’s pedestrian crash action plan, the pedestrian crashes practice overview.
Frequently asked questions
Which West Valley intersections have the most pedestrian crashes?
What time of day are pedestrians most at risk in Arizona?
Why are Arizona's pedestrian fatality numbers so high?
Can I sue if I was hit by a car while jaywalking in Arizona?
What should I do immediately after being hit by a car as a pedestrian?
Is Buckeye doing anything to fix dangerous pedestrian corridors?
Sources & references
- Arizona Department of Transportation. (2025). 2024 Arizona Motor Vehicle Crash Facts. Retrieved from https://azdot.gov/sites/default/files/2025-07/2024-Crash-Facts.pdf
- Arizona Department of Transportation. (2025). Arizona Motor Vehicle Crash Facts. Retrieved from https://azdot.gov/planning/traffic-safety/arizona-motor-vehicle-crash-facts
- Governors Highway Safety Association. (2024). Pedestrian Traffic Fatalities by State: 2023 Preliminary Data. Retrieved from https://www.ghsa.org/sites/default/files/2024-11/2023%20Pedestrian%20Traffic%20Fatalities%20by%20State.pdf
- National Highway Traffic Safety Administration. (2025). Pedestrian Safety. Retrieved from https://www.nhtsa.gov/road-safety/pedestrian-safety
- Maricopa Association of Governments. (2025). Regional Transportation Safety. Retrieved from https://azmag.gov/Programs/Transportation/Safety
- Arizona Governor's Office of Highway Safety. (2025). Statewide Highway Safety Resources. Retrieved from https://gohs.az.gov/statewide-highway-safety-resources
- US Census Bureau. (2025). QuickFacts: Buckeye City, Arizona https://www.census.gov/quickfacts/buckeyecityarizona
- Federal Highway Administration. (2024). Pedestrian and Bicycle Safety Program https://safety.fhwa.dot.gov/ped_bike/