Arizona launched a new five-year plan to cut deadly crashes this week. I read the announcement twice looking for the number. There isn’t one.
The state already has a number. It put one in writing in October 2024, in a plan signed by ten agency directors. And the 25 years of federal crash data behind that number tell you exactly how hard the new campaign’s job is going to be.
The Campaign With No Number
On June 29, the Arizona Department of Public Safety launched Arrive Alive Arizona, a five-year statewide traffic safety campaign. Four pillars: community engagement and education, high-visibility enforcement, strategic communications, and partnerships with ADOT, AAA Arizona, rideshare companies, and local law enforcement.
The announcement is heavy on commitment and light on arithmetic. Col. Jeffrey Glover, the AZDPS director, said traffic fatalities “are not inevitable” and framed the campaign as a long-term commitment. Lt. Col. Daven Byrd, speaking for the initiative, told KVOA the long-term goal is “to drive those numbers to zero.”
Zero is a direction, not a target. A target has a number and a date. The campaign announcement contains neither.
That matters because Arizona already wrote one down.
The Target That Already Exists
In October 2024, the directors of ADOT, the Governor’s Office of Highway Safety, AZDPS, the state health department, and six other agencies signed the 2024 Arizona Strategic Highway Safety Plan. Its stated goal, verbatim: reduce life-altering traffic crashes by 20% by 2030.
“Life-altering” means fatal and serious-injury crashes combined. The plan runs on five emphasis areas, more than 75 improvement strategies, and a Safe System framework. Col. Glover signed that document too.
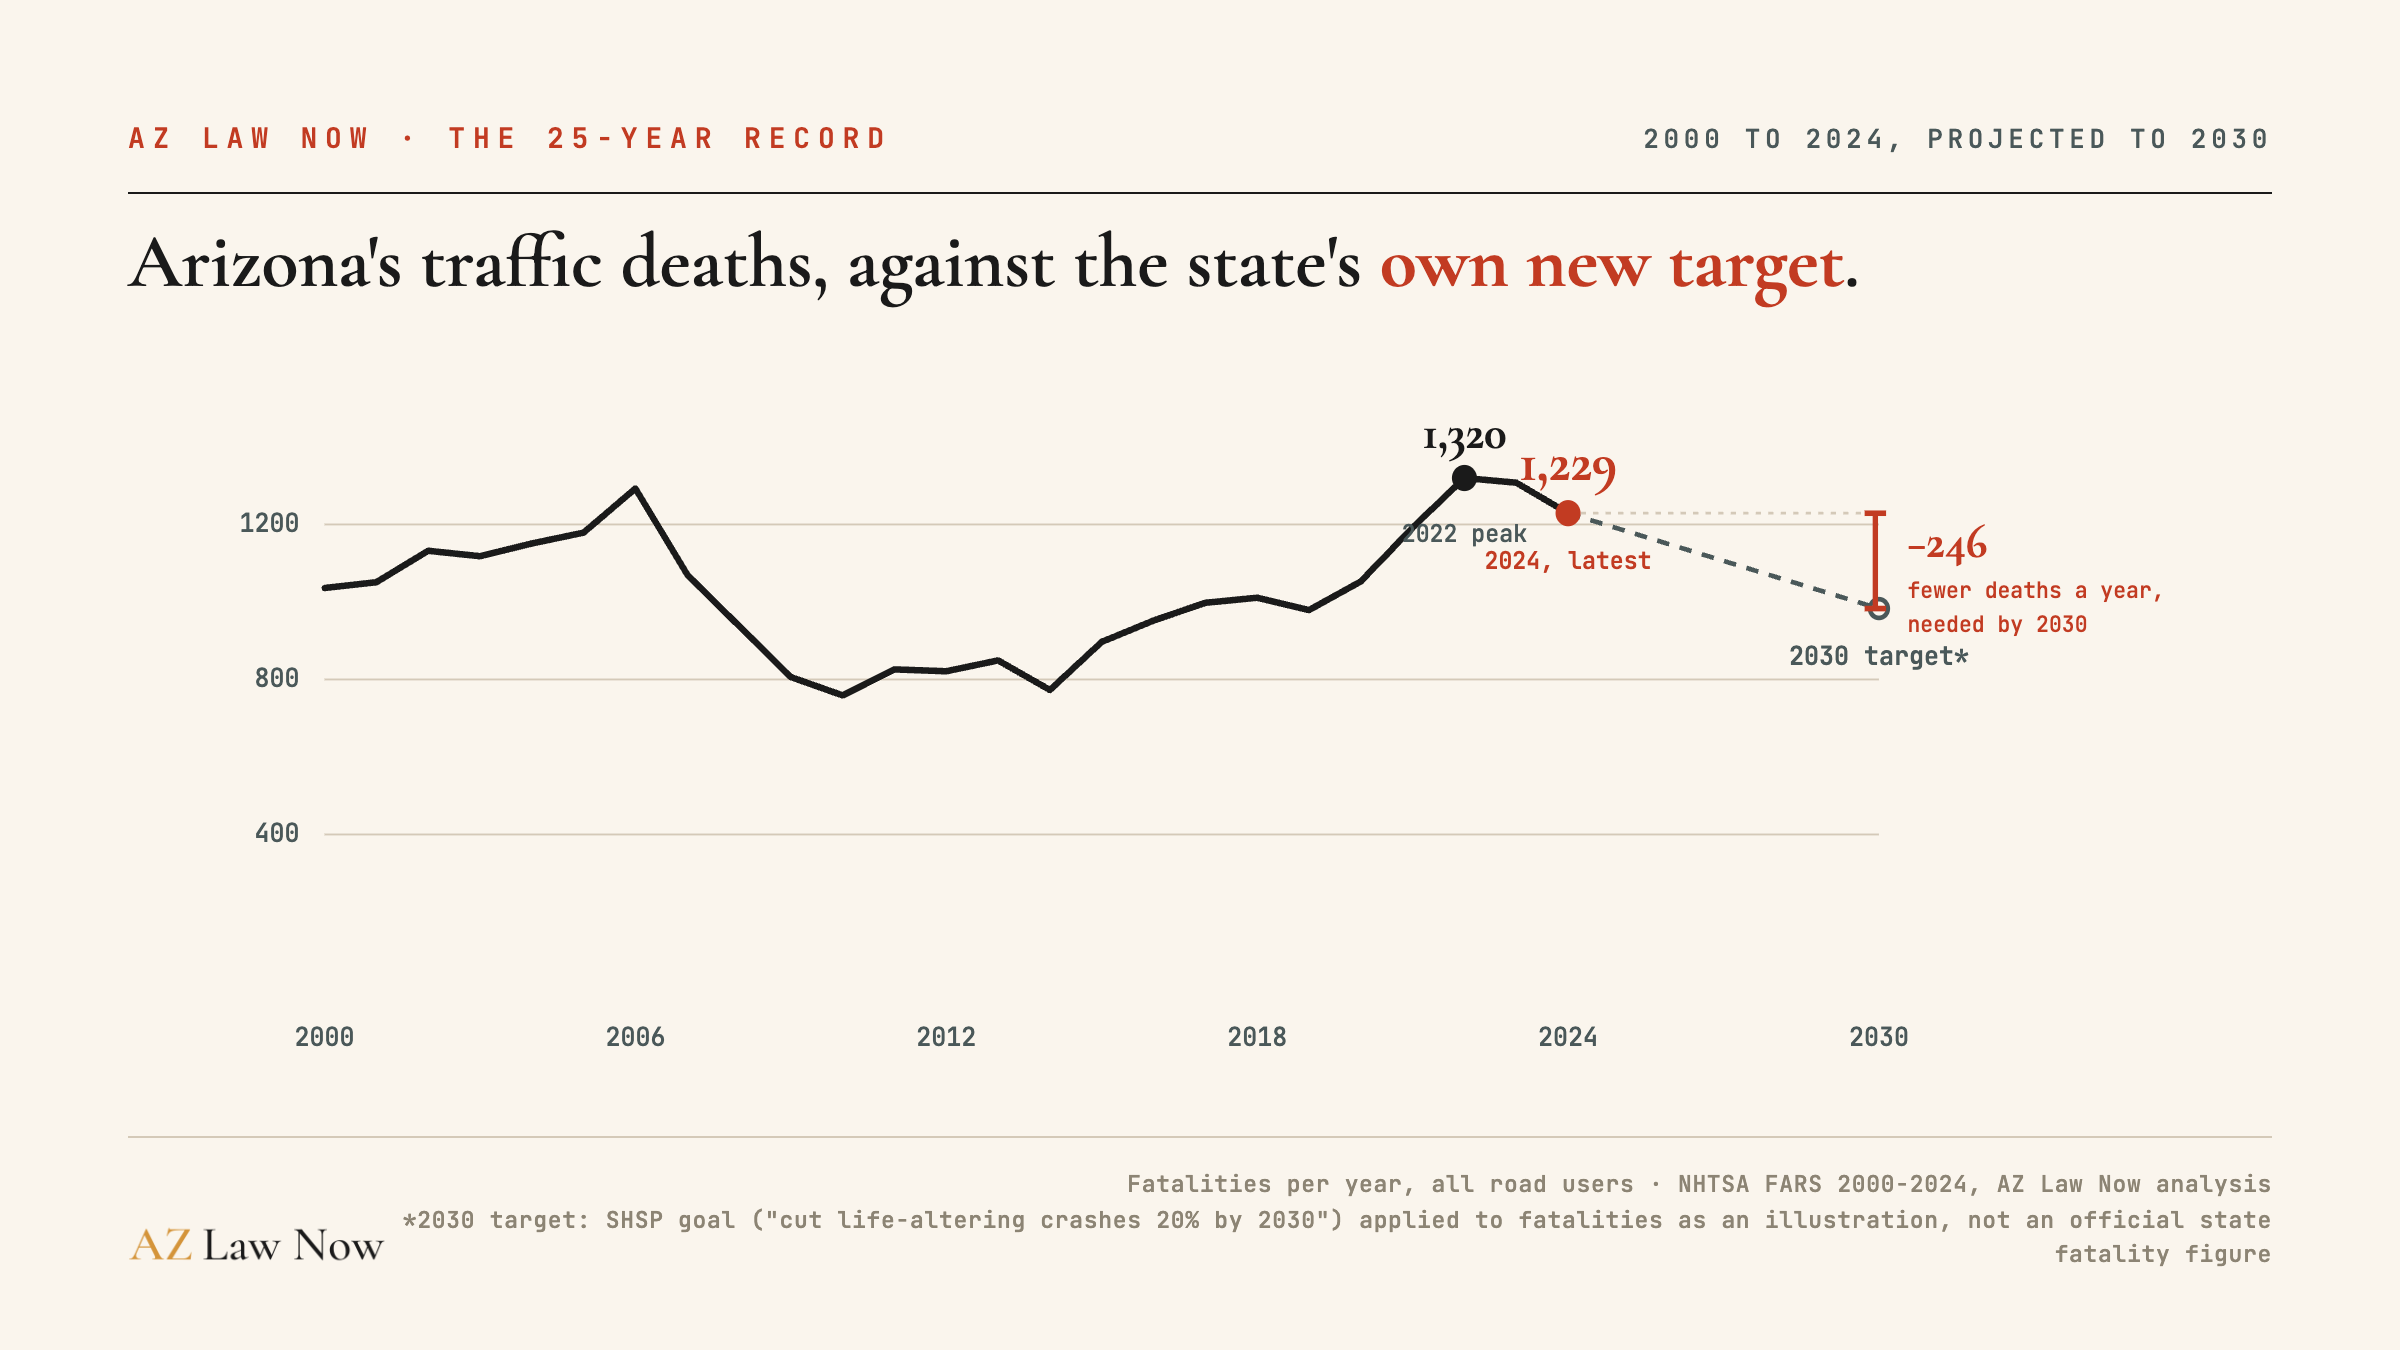
So the state’s real test isn’t rhetorical. It’s whether the line on the chart below bends 20% downward in the next four years. Here’s what that line has done for 25 years.
What 25 Years of Data Actually Show
I pulled every Arizona traffic death in the federal Fatality Analysis Reporting System from 2000 through 2024. That’s 25,742 people over 25 years, an average of about 1,030 a year.
The shape of the record matters more than the average. Arizona’s deaths climbed through the mid-2000s, peaked at 1,293 in 2006, then fell hard through the recession to a low of 759 in 2010. Then they climbed for a decade. The pandemic years poured fuel on it: 1,053 in 2020, 1,192 in 2021, and a record 1,320 in 2022.
The most recent five years are the deadliest five-year stretch in the whole record. Arizona is losing more people on its roads now than it did in 2000, despite a quarter century of safer cars, airbags in every seat, and automatic emergency braking.
The state’s own 2024 safety plan says this plainly. Since 2013, its authors write, Arizona’s population grew 12% while annual traffic fatalities grew 55%. I checked that against the federal data: from 849 deaths in 2013 to 1,320 in 2022 is a 55.5% increase. The state’s number holds up almost exactly.
There is one hopeful signal in the record. Deaths fell in 2023, to 1,308, and fell again in 2024, to 1,229. Two consecutive down years, the first since 2018-2019. The question the new campaign has to answer is whether that’s the start of a bend or another pause before the next climb.
For scale: over the past 20 years, Arizona’s traffic deaths grew about 0.3% per year on net. Hitting a 20% reduction by 2030 means sustaining roughly a 4% decline every single year. Arizona has managed back-to-back declines of that size only once in this record, in the recession years of 2007 through 2010, when people simply drove less.
The First Test Is This Weekend
Arrive Alive launched five days before July 4th. That’s not an accident of timing. The AZDPS announcement names the holiday directly, and its rideshare partnership is pitched at getting impaired people home “this Fourth of July.”
Nationally, the holiday has no rival. Across 25 years of federal crash data, July 4th ranks first out of all 366 calendar days for US traffic deaths, averaging about 139 deaths every July 4th, with a drinking driver involved in more than a third of them.
Arizona’s July 4th record is smaller but it has the same signature. Over 25 years, 82 people died on Arizona roads on July 4th, an average of 3.28 every year. What sets the day apart here isn’t raw volume. It’s what’s behind the wheel.
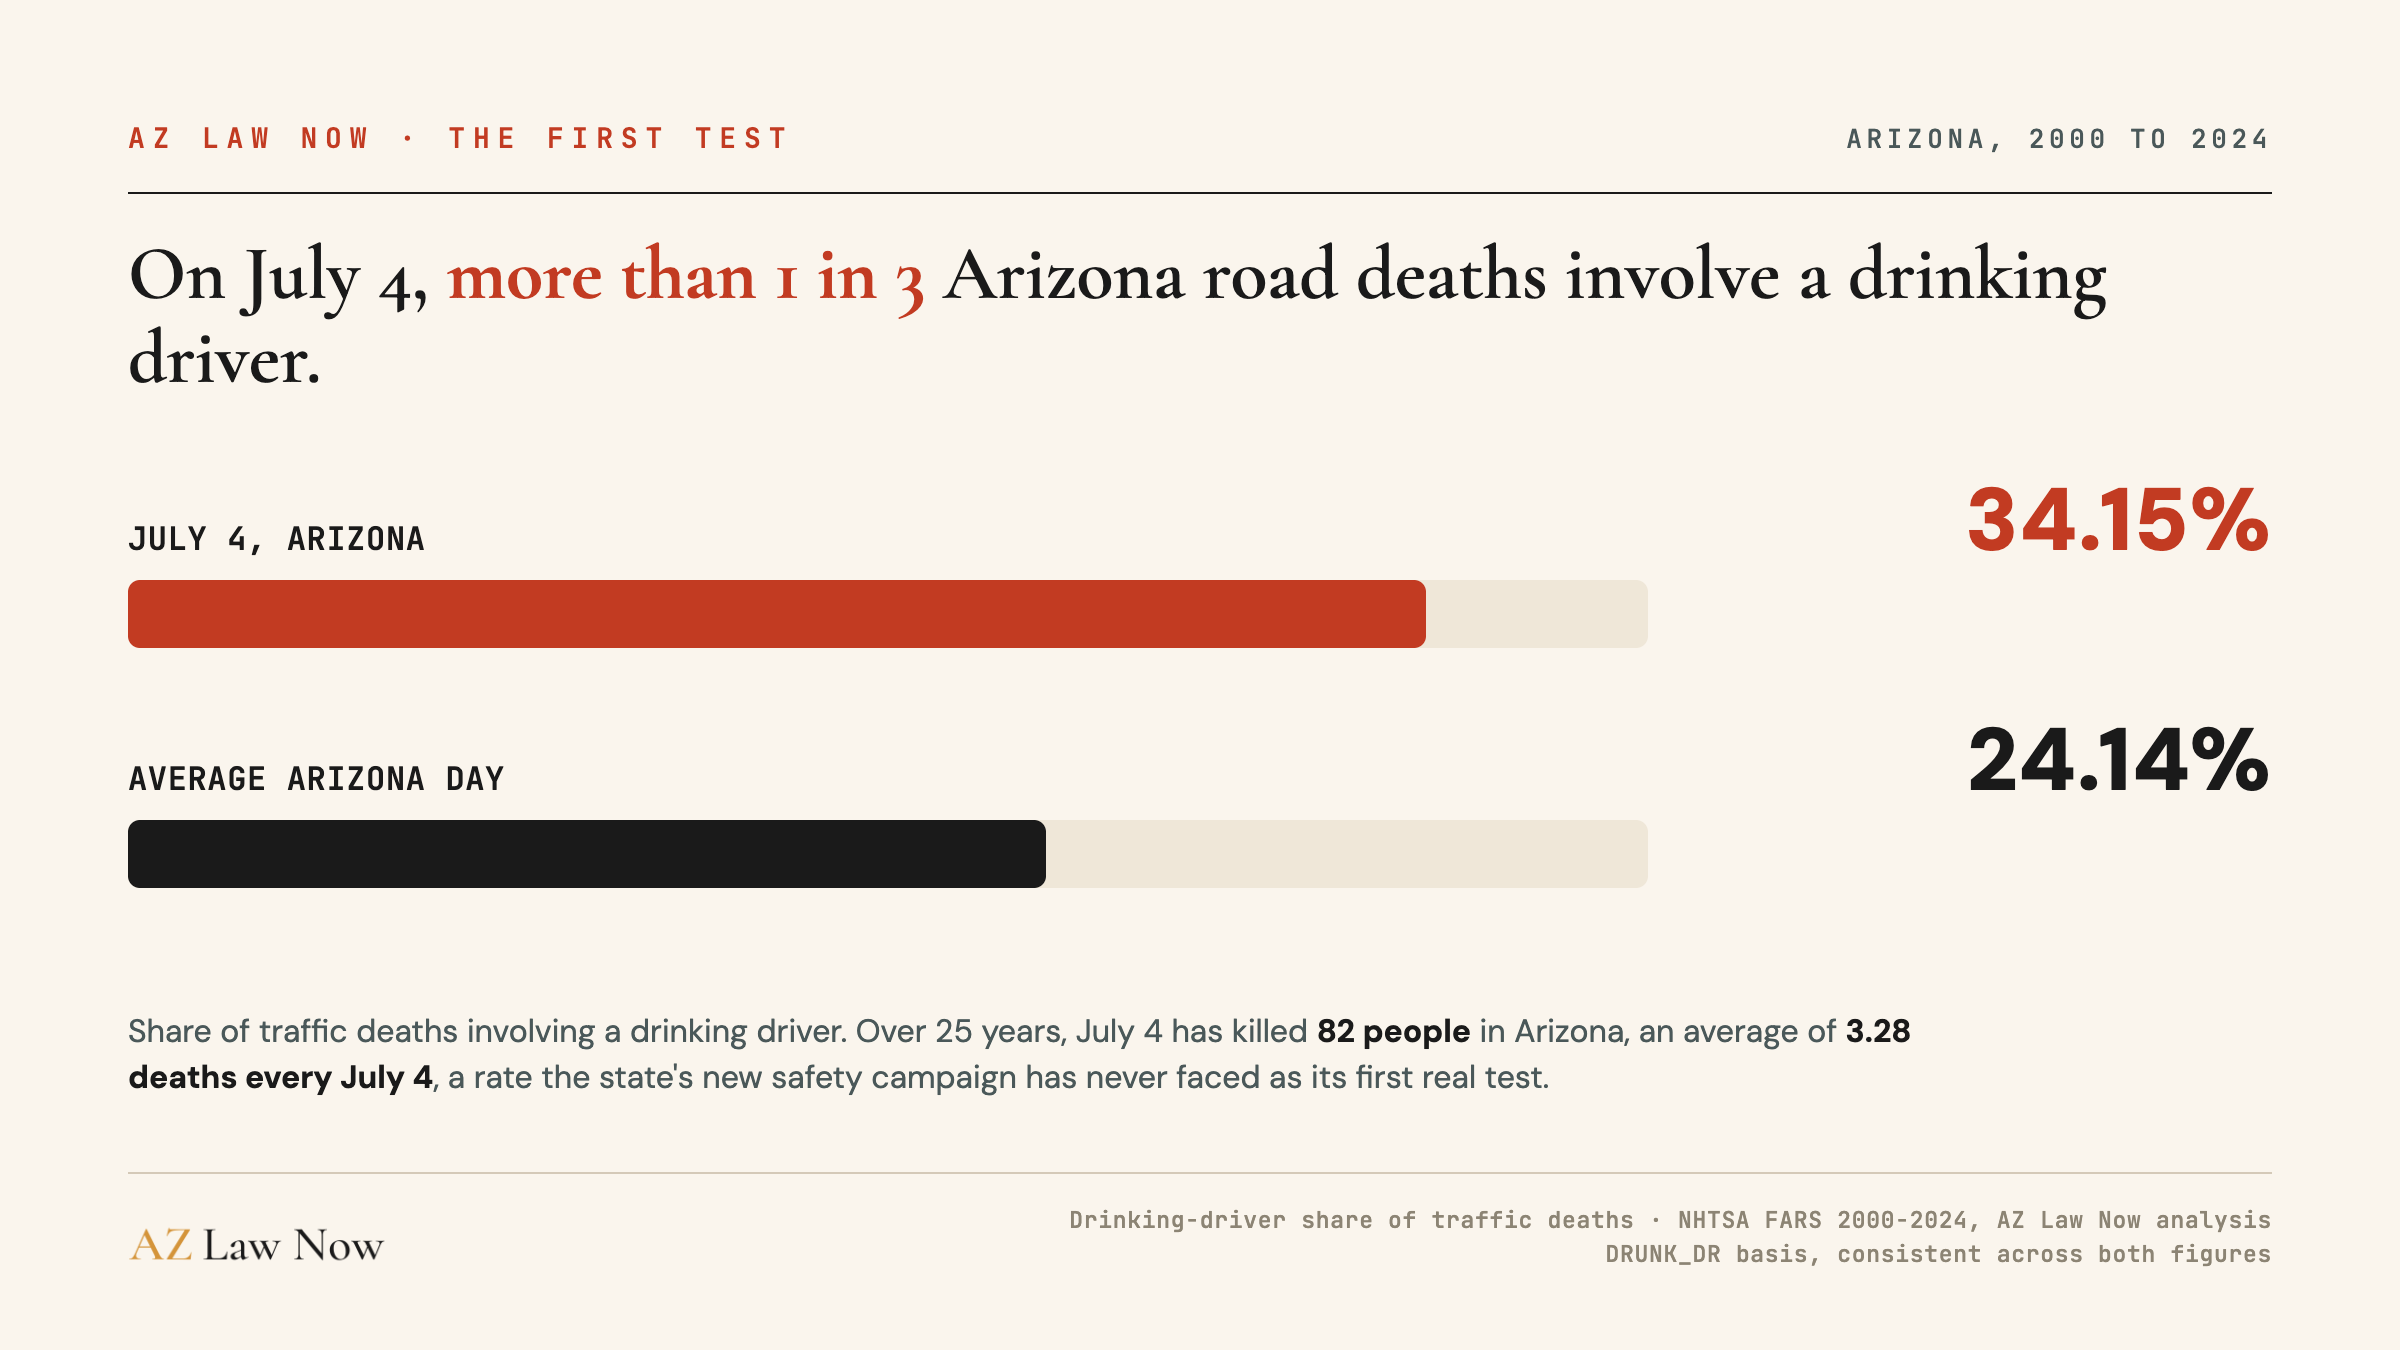
On an average Arizona day, a drinking driver is involved in about 24% of traffic deaths. On July 4th, that share jumps to more than 1 in 3. Ten percentage points is the difference between a bad day and a holiday that earns its own enforcement campaign.
If you’re driving this weekend, the practical version of all this data is short. The riskiest hours are after dark. The riskiest variable is a driver who’s been drinking, and on this particular holiday there are simply more of them. Leave earlier, or get a ride. If a crash does happen, Stephanie Ramirez’s guide to what to do after a drunk driving crash covers the first steps, and Arizona’s dram shop law can reach the bar that overserved the driver. Ron DeBrigida’s dram shop liability guide explains how.
Arizona has averaged 3.28 traffic deaths every July 4th since 2000. One year in that record, 2019, had zero. The new campaign’s stated purpose, in Lt. Col. Byrd’s words, is “every opportunity we have to not notify a family.” This weekend is its first measurable chance.
Where the Deaths Concentrate
Two structural shifts inside the 25-year record deserve their own attention, because a statewide campaign will succeed or fail on them.
Maricopa County keeps absorbing a bigger share. From 2000 through 2004, Maricopa accounted for 42% of Arizona’s traffic deaths. From 2020 through 2024, it accounted for 50%. Half the state’s problem now sits in one county’s arterials, freeways, and intersections. Phoenix’s own Vision Zero plan already ranked the city’s deadliest intersections, and the fix for the worst corridor doesn’t break ground until 2028.
Pedestrians are a fast-growing share of Arizona’s traffic deaths. In the early 2000s, people on foot were about 13% of Arizona’s traffic deaths. In the past five years, they were 21%. The federal data count 250 pedestrian deaths in 2024 alone. The state’s own planning documents acknowledge this: alongside the 2024 safety plan, ADOT published its first Active Transportation Safety Action Plan, aimed specifically at pedestrian and bicyclist deaths, and the plan’s authors report pedestrian and bicyclist fatalities up 90% since 2013. Our full investigation into why Arizona is one of the deadliest states to walk in traces it to road design.
Impairment threads through all of it. About 24% of Arizona’s traffic deaths involve a drinking driver on an ordinary day, and our Phoenix DUI crash data investigation maps where those crashes cluster.
What Would Have To Change
I want to be fair to the new campaign. Enforcement and education move behavior, and behavior is most of this problem. The state’s own emphasis areas name it: impairment, speed, distraction, lane departures, intersections.
And the two down years are real. A 7% decline from 1,320 to 1,229 over two years is the right direction at nearly the right slope. If Arizona sustained the 2024 rate of decline for six more years, the illustrative fatality version of the 2030 target would be within reach.
But the record earns the skepticism. Arizona has never sustained a six-year decline outside of a recession. The last decade’s climb happened while every one of these strategies, patrols, campaigns, engineering fixes, already existed. The new plan’s four pillars are the same four tools the state was holding while deaths rose 55%.
What’s different now is that the target is written down, signed, and dated. Cut life-altering crashes 20% by 2030. That’s the number every annual crash report between now and then should be measured against, starting with the one that will count this weekend.
We’ll track it. When the 2025 federal numbers publish, this analysis gets updated, and the chart above either starts bending toward 983 or it doesn’t.
Related Coverage
For the legal context after a crash, see Ron DeBrigida’s guide to Arizona car crash law and Stephanie Ramirez’s first 48 hours checklist. For the data behind specific corridors, our West Valley dangerous intersections investigation covers the arterials most at risk.
Frequently asked questions
What is Arrive Alive Arizona?
Does Arizona have an official traffic death reduction target?
How many people die on Arizona roads each year?
Is July 4th really the most dangerous day to drive?
What should I do if a drunk driver hits me in Arizona?
Can I sue if road design contributed to my crash?
Sources & references
- Arizona Department of Public Safety. (2026, June 29). AZDPS Launches Arrive Alive Arizona, A Five-Year Statewide Traffic Safety Campaign. Retrieved from https://www.azdps.gov/news/releases/1125
- Arizona Department of Transportation, Governor's Office of Highway Safety, et al. (2024, October). 2024 Arizona Strategic Highway Safety Plan. Retrieved from https://azdot.gov/sites/default/files/2024-10/arizona-shsp-final-10-15-24-noappendices-signed.pdf
- National Highway Traffic Safety Administration. (2025). Fatality Analysis Reporting System (FARS), 2000-2024, Arizona. Retrieved from https://www.nhtsa.gov/research-data/fatality-analysis-reporting-system-fars
- KVOA News 4 Tucson. (2026, June 30). Arizona launches 5-year plan to cut deadly crashes statewide. Retrieved from https://www.kvoa.com/news/arizona/arizona-launches-5-year-plan-to-cut-deadly-crashes-statewide/article_fbd30ab7-bfb2-4b09-90f9-4f1cc4cedf16.html
- Arizona Department of Transportation. (2024, October). Active Transportation Safety Action Plan. Retrieved from https://azdot.gov/sites/default/files/2024-10/atsap-final-10-15-24-noappendices.pdf
- Arizona State Legislature. (2025). ARS 4-311: Liability for serving intoxicated person. Retrieved from https://www.azleg.gov/ars/4/00311.htm